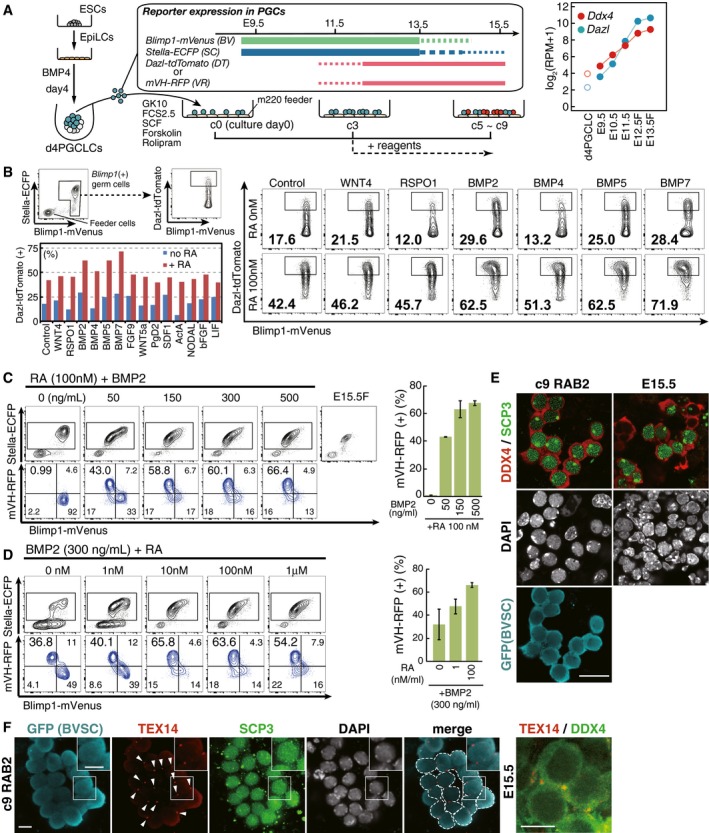
Figure 1. A screening for the factors inducing the female germ‐cell fate.

-
A(Left) Scheme for the screening of the factors inducing the female germ‐cell fate. d4/c0 PGCLCs [Blimp1‐mVenus (BV) (+) cells] induced from BV; Stella‐ECFP (SC); Dazl‐tdTomato (DT) (XY) or BVSC; mVH‐RFP (VR) (XX) ESCs were sorted by FACS onto m220 feeder cells and cultured in GMEM with 10% KSR (GK10) and 2.5% fetal calf serum (FCS) in the presence of forskolin, rolipram and SCF (Ohta et al, 2017). Cytokines/chemicals for the screening were provided from c3 (forskolin, rolipram, and SCF were provided throughout the culture). (Right) Expression of Dazl and Ddx4 in d4 PGCLCs and germ cells from E9.5 to E13.5 (female germ cells at E12.5 and E13.5) measured by RNA‐seq (Sasaki et al, 2015; Yamashiro et al, 2016; Ohta et al, 2017). The averages of two replicates are shown.
-
B(Top left) Scheme for the FACS. The DT levels among BV (+) cells were analyzed at c7. (Right) The FACS results for the cultures with the indicated conditions. The number indicates the percentage of DT (+) cells within the indicated gate. The concentration of the indicated cytokines is 500 ng/ml. See Appendix Fig S1 for larger FACS images and the data for other cytokines. (Bottom left) Summary of the screening results. Percentages of DT (+) cells among BV (+) cells under the indicated conditions are shown.
-
C, D(Left) Representative FACS plots of c9 cells (BVSCVR) under the indicated conditions. The boxed areas [SC (+) cells] in the upper plots were separated with BV and VR in the lower plots. A BVSC plot of E15.5 fetal primary oocytes is shown in (C). (Right) Percentage of the VR (+) cells under the indicated conditions. The means and the standard deviations (SDs) of two independent experiments are shown.
-
EDDX4 and SCP3 expression with DAPI in E15.5 fetal oocytes (right) and c9 RAB2 cells [BV/SC (+)] induced from BVSC ESCs (XX) (left). Scale bar, 20 μm.
-
FTEX14 expression (arrowheads) in c9 RAB2 cells [left panels: BV/SC (+)/SCP3 (+) oocyte cyst‐like structure] induced from BVSC ESCs (XX) (the boxed area is magnified in the inset) and in fetal oocytes at E15.5 (right). Scale bars, 10 μm.
