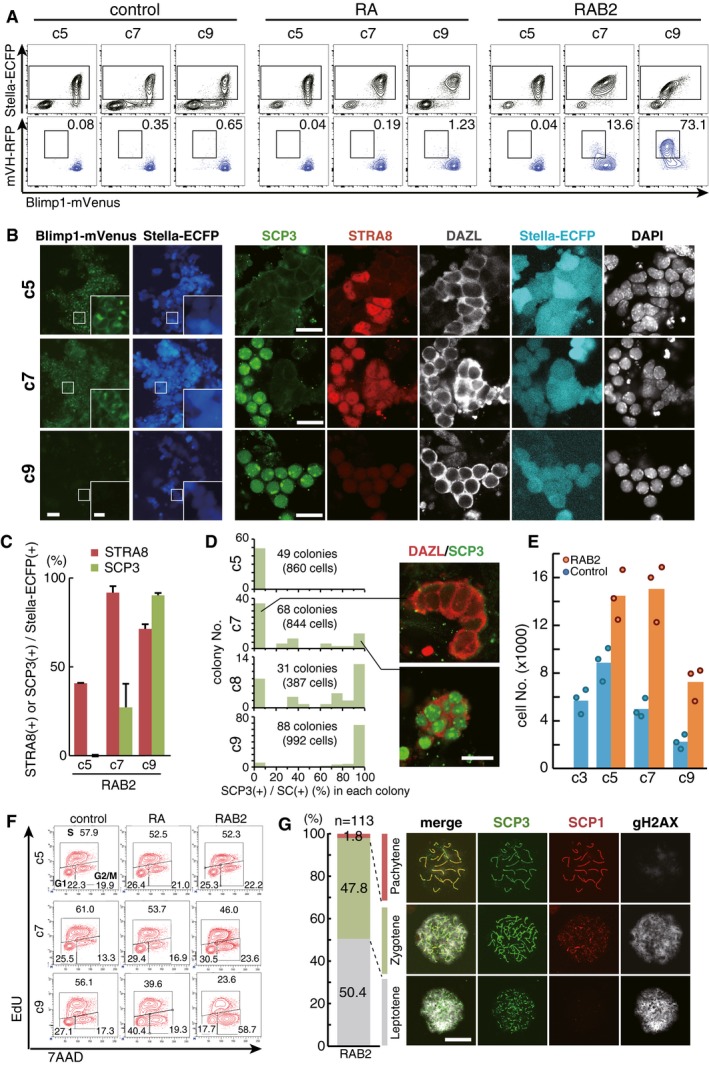
Representative FACS plots [top: Blimp1‐mVenus (BV); Stella‐ECFP (SC) expression; bottom: BV; mVH‐RFP (VR) expression] of the PGCLC culture under the control condition (left), with RA (100 nM) (middle), and with RA (100 nM) and BMP2 (300 ng/ml) (right) at c5, c7, and c9. The SC (+) cells boxed in the top panels were analyzed in the bottom panels, with percentages of cells in the boxed areas indicated.
(Left) BVSC fluorescence and (right) SCP3/STRA8/DAZL expression in BV/SC (+) cells during the PGCLC culture with RA (100 nM) and BMP2 (300 ng/ml) at c5, c7, and c9. The boxed areas in the left panels are magnified in the insets. Scale bars, 40 μm (left), 10 μm (left, inset), and 20 μm (right).
The percentages of STRA8 (+) and SCP3 (+) cells among BV/SC (+) cells, based on IF analyses at c5, c7, and c9. The means and the SDs of two independent experiments are shown.
Synchronicity of entry into the meiotic prophase. The vertical axis indicates the numbers of colonies counted. The horizontal axis indicates the percentage of SCP3 (+) cells within BV/SC (+) colonies. The colonies consisting of more than two cells were counted. Images of the representative colonies with or without SCP3 expression are shown on the right. Scale bar, 20 μm.
The numbers of BV (+) cells during the control culture and the culture with RA (100 nM) and BMP2 (300 ng/ml). 1,500 BV (+) d4 PGCLCs were seeded at c0. One dot represents the average of five replicated culture wells, and the bar represents the mean of the dots.
Cell cycle of PGCLCs cultured under the control condition, with RA (100 nM), and with RA (100 nM) and BMP2 (300 ng/ml) at c5, c7, and c9 as analyzed by EdU and 7AAD incorporation.
The progression of meiosis examined by spread analyses of SCP3/γH2AX/SCP1 expression (Meuwissen
et al,
1992; Yuan
et al,
2000; Mahadevaiah
et al,
2001) at c9 with RA and BMP2. The percentages of cells at the indicated stages are shown. Scale bar, 20 μm.

