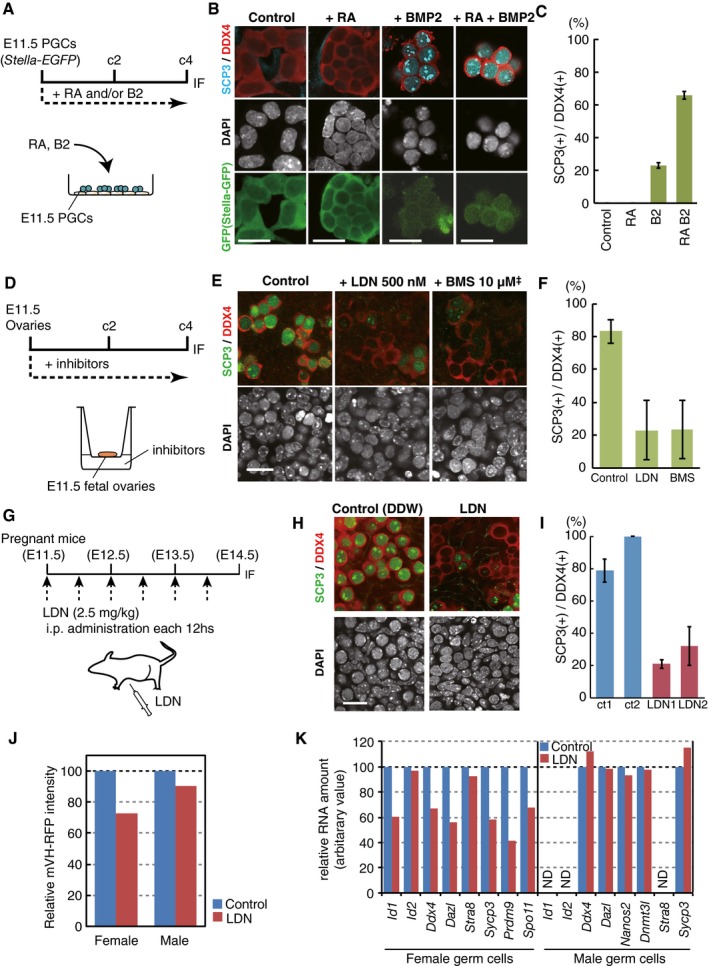
Scheme of the PGC culture. Stella‐EGFP (SG) (+) cells were cultured with forskolin, rolipram, and SCF on m220 feeder cells, and RA (100 nM) and/or BMP2 (300 ng/ml) were provided at c0.
DDX4/SCP3/SG expression under the indicated conditions at c4. Scale bar, 20 μm.
The percentages of SCP3 (+) cells among DDX4 (+) cells. The means and SDs of duplicated wells are shown.
Scheme of the E11.5 fetal ovary culture. BMS493 (10 μM
1) or LDN1931189 (500 nM) was provided at c0.
DDX4/SCP3 expression under the indicated conditions at c4. Scale bar, 20 μm.
2
The percentages of SCP3 (+) cells among DDX4 (+) cells. The means and SDs of two independent experiments are shown.
Scheme of the LDN1931189 administration (2.5 mg/kg, every 12 h) in pregnant mice.
DDX4/SCP3 expression at E14.5 in embryonic ovaries administered water (control) or LDN1931189 as in (G). Scale bar, 20 μm.
The percentages of SCP3 (+) cells among DDX4 (+) cells. The means and SDs in two anterior and two posterior regions of the gonads are shown.
Relative mVH‐RFP (VR) intensities at E14.5 analyzed by FACS of female or male VR (+) cells administered water (control) or LDN1931189 as in (G). The VR intensity of the control cells is set as 100.
Relative expression levels of the indicated genes at E14.5 analyzed by qPCR in female or male VR (+) cells administered water (control) or LDN1931189 as in (G). The levels in the control cells are set as 100. ND, not detected.

