-
A
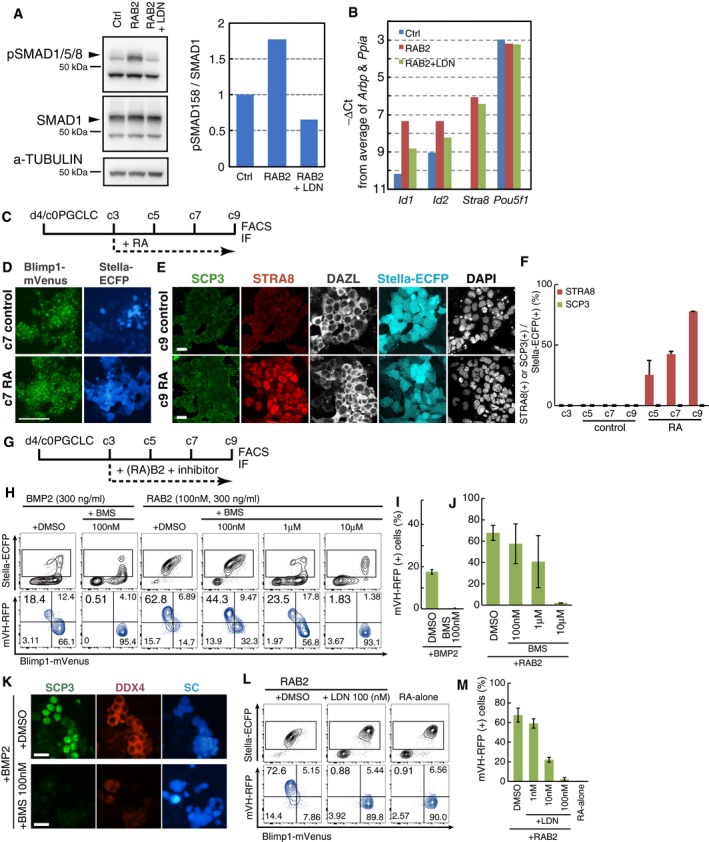
(Left) Western blot analysis of the levels of phosphorylated (p) SMAD1/5/8, total SMAD1 and α‐TUBULIN (loading control) in d4 PGCLCs under the control condition, stimulated with RA (100 nM) and BMP2 (300 ng/ml) for 1 h, or with RA, BMP2, and LDN193189 (100 nM) for 1 h. (Right) Quantification of the relative levels of pSMAD1/5/8 ratio (/total SMAD) in the (left).
-
B
qPCR analysis of the levels of the indicated genes in d4c5 PGCLCs cultured under the control condition, stimulated with RA (100 nM) and BMP2 (300 ng/ml) from c3, or with RA, BMP2, and LDN193189 (100 nM) from c3. For each gene examined, the ∆CT from the average CT values of the two independent housekeeping genes Arbp and Ppia (set as 0) were calculated and plotted.
-
C
Scheme for the experiments in (D–F).
-
D, E
Blimp1‐mVenus (BV); Stella‐ECFP (SC) fluorescence (D) and IF images for SCP3, STRA8, DAZL, and BV/SC (E) of c7 (D) or c9 (E) cells cultured without (control) or with RA. Scale bars, 100 μm in (D) and 20 μm in (E).
-
F
The percentages of STRA8 (+) and SYCP3 (+) cells among BV/SC (+) cells. The percentages of STRA8 (+) and SCP3 (+) cells among BV/SC (+) cells, based on IF analyses at c5, c7, and c9. The means and the SDs of two independent experiments are shown.
-
G
Scheme for the experiments in (H–M).
-
H
Representative BVSC (top) or BV; mVH‐RFP (VR) (bottom) FACS plots of c9 cells cultured under the indicated conditions. SC (+) cells (boxed cells in the top panels) were analyzed in the bottom panels. The percentages of cells plotted in each quadrant are indicated in the bottom panels.
-
I, J
The percentages of the VR (+) cells under the indicated conditions. The means and SDs of two independent experiments are shown.
-
K
SCP3 and DDX4 expression in c9 BV/SC (+) cells cultured under the indicated conditions. Scale bars, 20 μm.
-
L
Representative BVSC (top) or BVVR (bottom) FACS plots of c9 cells cultured under the indicated conditions. SC (+) cells (boxed cells in the top panels) were analyzed in the bottom panels. The percentages of cells plotted in each quadrant are indicated in the bottom panels.
-
M
The percentages of the VR (+) cells under the indicated conditions. The means and SDs of two independent experiments are shown.

