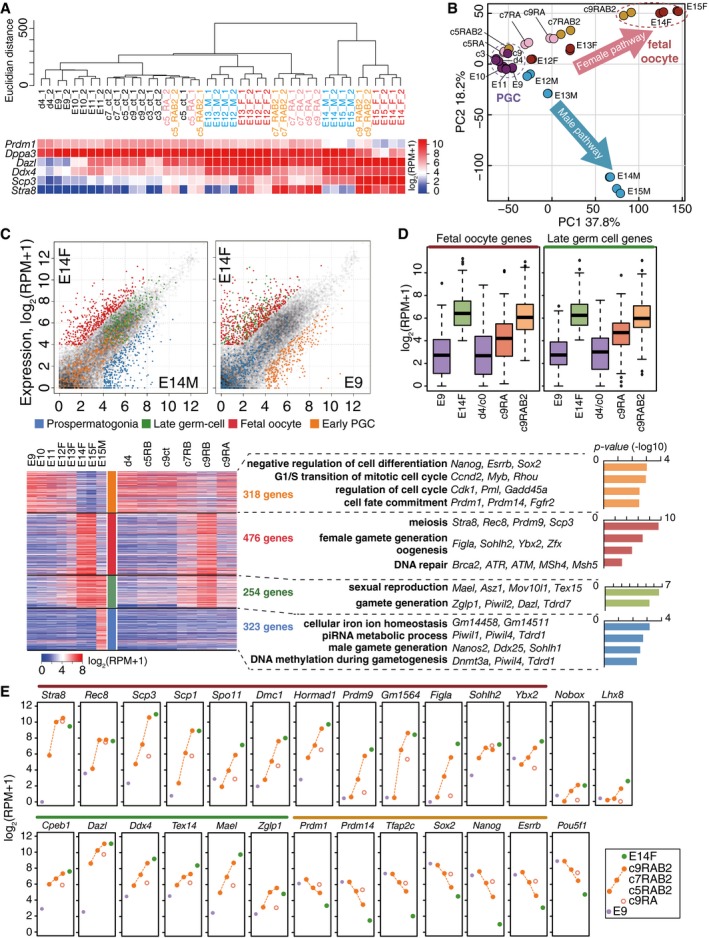
UHC (Ward method) of the indicated cells using genes with log2(RPM+1) > 2 in at least one sample (15,849 genes) and a heat map of the expression levels of key genes. ct: cultured PGCLCs without RA or BMP2. The color coding is as indicated.
PCA of germ cells in vivo (E9.5–E11.5 PGCs, E12.5–E15.5 male and female germ cells) and in vitro (cultured PGCLCs). A purple dotted circle clusters PGCs (E9.5, E10.5, E11.5) and PGCLCs (c0, c3, c9). A red dotted circle clusters fetal oocytes (E14.5, E15.5 female germ cells) and c9 RAB2 cells. Blue, red, pink, and yellow represent male germ cells, female germ cells, PGCLCs cultured with RA, and PGCLCs cultured with RAB2, respectively.
(Top) Scatter‐plot comparison of gene expressions between E14.5 male and female germ cells (left) and between E14.5 female and E9.5 germ cells (right). Orange, green, red, blue, and gray dots indicate early PGC genes [318 genes: log2 fold‐change: E9.5 – male/female E14.5 > 2, log2(RPM+1) at E9.5 > 4], late germ‐cell genes [254 genes: log2 fold‐change: male/female E14.5 – E9.5 > 2, log2(RPM+1) at male/female E14.5 > 4], fetal oocyte genes [476 genes: log2 fold‐change: female E14.5 – male E14.5 > 2, female E14.5 – E9.5 > 2, log2(RPM+1) at female E14.5 > 4], PSG genes [323 genes: log2 fold‐change: male E14.5 – female E14.5 > 2, male E14.5 – E9.5 > 2, log2(RPM+1) at male E14.5 > 4], and non‐classified genes, respectively. (Bottom left) A heat map of the expression of early PGC genes (orange), late germ‐cell genes (green), fetal oocyte genes (red), and PSG genes (blue) (in total: 1,371 genes) in germ cells in vivo and in vitro as indicated. (Bottom right) GO enrichments (P‐values indicated) and key genes for each gene class.
Box plots of the levels of fetal oocyte genes (left) and late germ‐cell genes (right) in the indicated cells [the averages (horizontal lines), 25th and 75th percentiles (boxes), and 5th and 95th percentiles (error bars) are shown].
Expression [log2(RPM+1)] of key genes during female sex determination of PGCLCs/PGCs. The averages of two replicates are shown. Purple, green, and orange filled circles and red open circles represent E9.5 PGC, E14.5 fetal oocytes, c9 RAB2 cells, and c9 RA cells, respectively. The lines above the gene name are color‐coded as in (C).

