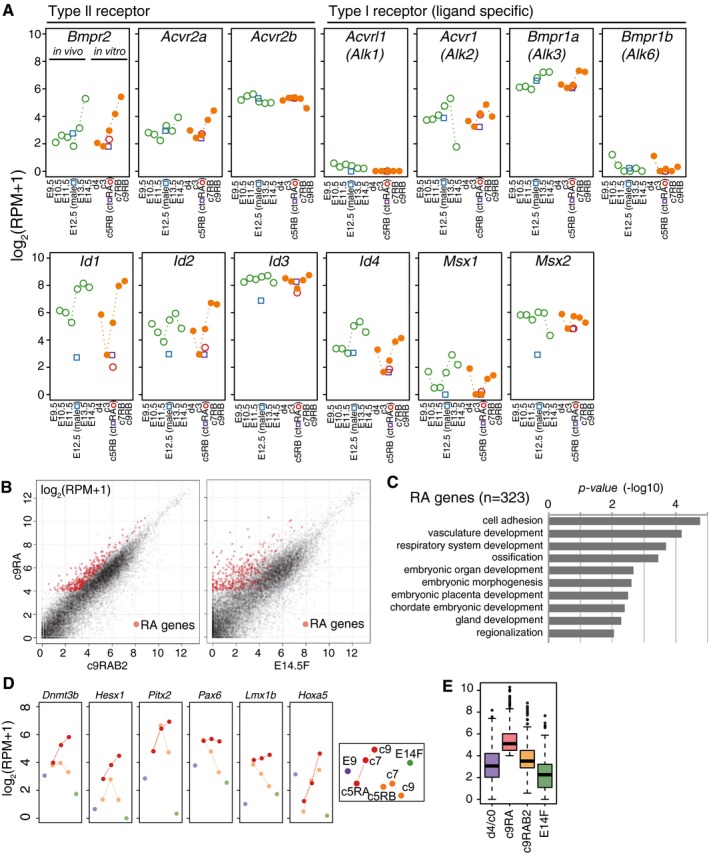
Figure EV4. RA induces ectopic developmental genes.

- Expression [log2(RPM+1)] of receptors and representative targets of the BMP signaling during female sex determination of PGCLCs (orange filled circles)/PGCs (green open circles). The averages of two replicates are shown. Expression levels in E12.5 male germ cells (blue open squares), d4c5 control cells (purple open squares), and d4c5 RA cells (red open circles) are also shown.
- Scatter‐plot comparisons of gene expression (left) between c9 RAB2 cells and c9 RA cells, or (right) between E14.5 primary oocytes and c9 RA cells. The ectopic RA genes (323 genes: log2(RPM+1) > 4; log2 fold‐change: c9 RA – c9 RAB2 > 1 and c9 RA – d4 PGCLCs > 1) are shown in red.
- GO enrichments in the RA genes. P‐values are indicated.
- Expression [log2(RPM+1)] of selected RA genes in the indicated cells (the color coding is as indicated).
- Box plots of the levels of the RA genes in the indicated cells [the averages (horizontal lines), 25th and 75th percentiles (boxes), and 5th and 95th percentiles (error bars) are shown].
