Abstract
Methionine metabolism is critical for epigenetic maintenance, redox homeostasis, and animal development. However, the regulation of methionine metabolism remains unclear. Here, we provide evidence that SIRT1, the most conserved mammalian NAD +‐dependent protein deacetylase, is critically involved in modulating methionine metabolism, thereby impacting maintenance of mouse embryonic stem cells (mESCs) and subsequent embryogenesis. We demonstrate that SIRT1‐deficient mESCs are hypersensitive to methionine restriction/depletion‐induced differentiation and apoptosis, primarily due to a reduced conversion of methionine to S‐adenosylmethionine. This reduction markedly decreases methylation levels of histones, resulting in dramatic alterations in gene expression profiles. Mechanistically, we discover that the enzyme converting methionine to S‐adenosylmethionine in mESCs, methionine adenosyltransferase 2a (MAT2a), is under control of Myc and SIRT1. Consistently, SIRT1 KO embryos display reduced Mat2a expression and histone methylation and are sensitive to maternal methionine restriction‐induced lethality, whereas maternal methionine supplementation increases the survival of SIRT1 KO newborn mice. Our findings uncover a novel regulatory mechanism for methionine metabolism and highlight the importance of methionine metabolism in SIRT1‐mediated mESC maintenance and embryonic development.
Keywords: embryonic development, histone methylation, methionine, SAM, SIRT1
Subject Categories: Chromatin, Epigenetics, Genomics & Functional Genomics; Metabolism; Stem Cells
Introduction
The developing embryos require a number of indispensable nutrients to support rapid cell division during the early stages of fetal development. In particular, embryonic stem cells (ESCs) derived from the inner cell mass of a blastocyst demand a high glycolytic flux and consume high levels of exogenous glutamine for rapid growth and maintenance of pluripotency (Dang, 2012; Folmes et al, 2012; Ward & Thompson, 2012; Carey et al, 2015). The developing fetuses and ESCs also have a high dependence on one‐carbon catabolism, a large network consisting of two independent cycles of folate and methionine (Wang et al, 2009; Kalhan & Marczewski, 2012; Locasale, 2013; Shiraki et al, 2014). These metabolic programs not only provide anabolic precursors for biosynthesis, but also produce intermediate metabolites, such as acetyl‐CoA, α‐ketoglutarate, and S‐adenosylmethionine (SAM), which function as substrates or cofactors for enzymes that regulate chromatin modification and gene expression (Wellen et al, 2009; Cai et al, 2011; Xu et al, 2011; Shyh‐Chang et al, 2013a; Shiraki et al, 2014). Poor fetal nutrition is associated with reduced fetal growth, low birthweight, as well as many other developmental defects, leading to increased risk of disease in postnatal life (Barker, 2004; Rees et al, 2006). A number of genetic factors, including Lin28, hypoxia‐induced factor 1α (HIF1α), and c‐Myc, actively participate in the regulation of cell glucose and glutamine metabolism (Dang et al, 2009; Peng et al, 2011; Shyh‐Chang et al, 2013b; Takubo et al, 2013; Ito & Suda, 2014). However, remarkably, little is known about the regulation of cellular methionine metabolism in response to environmental signals and developmental cues.
SIRT1 is the most conserved mammalian NAD+‐dependent protein deacetylase and an important cellular metabolic and stress sensor. Through deacetylation of transcription factors and cofactors critically involved in metabolic homeostasis, inflammatory responses, and stress resistance, SIRT1 directly couples cellular metabolic status (via NAD+) to transcriptional reprogramming in response to environmental changes (Schug & Li, 2011; Guarente, 2013; Imai & Guarente, 2014). SIRT1 also plays a critical role in animal development. Whole‐body SIRT1 KO mice display severe developmental defects in multiple tissues on various mixed genetic backgrounds, including intrauterine growth retardation, developmental defects of the retina and heart, defective germ cell differentiation, and neonatal lethality (Cheng et al, 2003; McBurney et al, 2003; Wang et al, 2008). However, despite several reports about SIRT1 in differentiation and apoptosis of precursor/stem cells (Han et al, 2008; Prozorovski et al, 2008; Kang et al, 2009; Tang et al, 2014; Williams et al, 2016; Heo et al, 2017), the possible role of this key cellular metabolic sensor in metabolic regulation of ESC functions and embryonic development is completely unknown, and the molecular mechanisms underlying SIRT1 deficiency‐induced development defects remain elusive.
In the present study, we discovered that the SIRT1‐Myc axis is a novel regulatory mechanism for cellular methionine metabolism, which in turn impacts maintenance of mESCs and subsequent development of mouse embryos. Through global metabolomics, functional analysis of metabolism, and in vivo mouse studies, we show that loss of SIRT1 impairs the activity of Myc, resulting in decreased expression of methionine adenosyltransferase 2 (Mat2), reduced conversion of methionine to SAM, and decreased histone methylation. This defect is one of the major contributors to the comprised maintenance of SIRT1‐defective mESCs and subsequent developmental defects of SIRT1 KO mice. Our findings identified a novel genetic pathway that regulates the cellular methionine metabolism in response to developmental cues and significantly advanced our understanding of gene–environment interactions that govern embryogenesis.
Results
Loss of SIRT1 specifically impairs methionine metabolism in mESCs
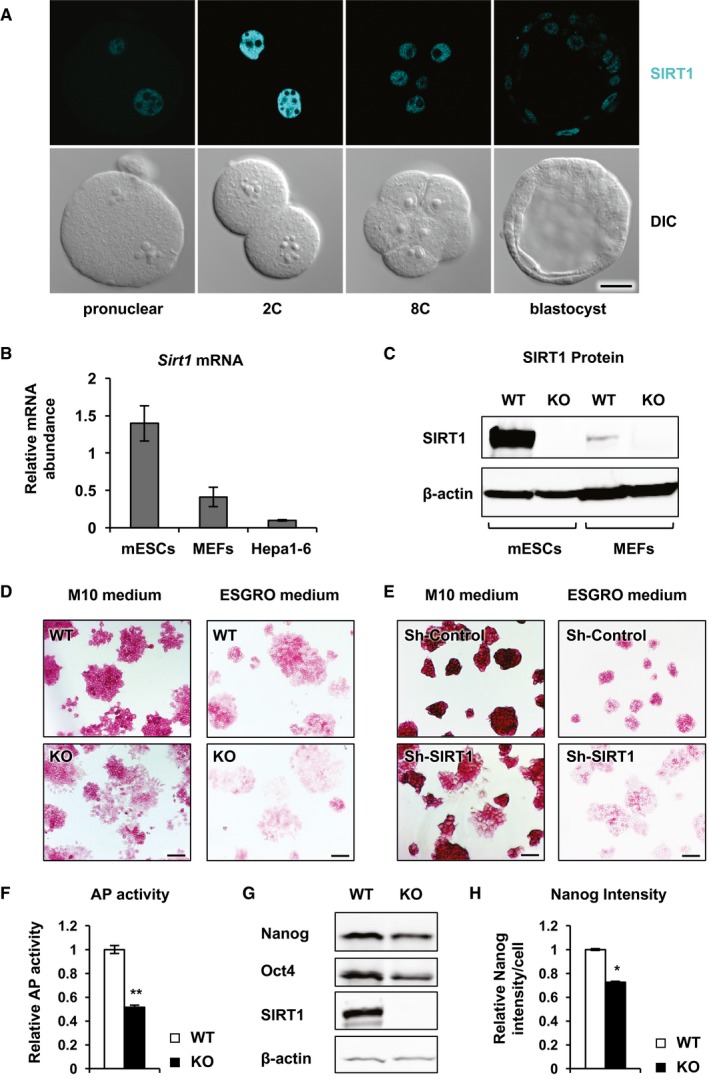
SIRT1 was highly expressed in pre‐implantation embryos, including pluripotent mESCs derived from the inner cell mass of a blastocyst compared to differentiated cells (Fig 1A–C). Consistently, deleting or knocking down this protein in pluripotent mESCs reduced their maintenance in two different maintenance media (Fig 1D–F), as indicated by a reduction in the activity of alkaline phosphatase, a marker of undifferentiated ESCs, and/or the increased flattening of the cell colonies in SIRT1‐deficient mESCs compared to control WT mESCs and sh‐Control mESCs. Moreover, the protein levels of two ESCs pluripotency markers, Nanog and Oct4, were significantly reduced in SIRT1 KO mESCs when cultured in the M10 medium, a DMEM‐based serum‐containing mESC maintenance medium (Fig 1G and H, and Appendix Fig S1). These results suggest a direct role of SIRT1 in maintaining the stem cell state of mESCs.
Figure 1. SIRT1‐deficient mESCs are prone to differentiation in ES cell maintenance media.
-
ASIRT1 immunolabeling (cyan) and differential interference contrast (DIC) images of mouse wild‐type pre‐implantation embryos of the indicated stages. The immunolabeling was performed three times, and representative images are shown. Scale bar, 20 μm.
-
B, CSIRT1 is highly expressed in mESCs compared to differentiated mouse embryonic fibroblasts (MEFs) and hepatocytes (Hepa1‐6) (n = 3 independent experiments).
-
DSIRT1 KO mESCs display reduced pluripotency phenotypes in ES cell maintenance media. WT and SIRT1 KO mESCs cultured in the complete M10 medium or ESGRO medium were stained for the AP activities. Scale bars, 100 μm.
-
ESh‐SIRT1 mESCs display enhanced differentiation phenotypes in ES cell maintenance media. Sh‐Control and sh‐SIRT1 mESCs were cultured and analyzed as in (D). Scale bars, 100 μm.
-
FSIRT1 KO mESCs have reduced AP activities when cultured in the complete M10 medium. The activities of AP were measured in total cell lysates as described in Materials and Methods (n = 5 independent experiments).
-
GSIRT1 KO mESCs have reduced expression of ESC markers when cultured in the complete M10 medium. The protein levels of two ESC markers, Nanog and Oct4, were analyzed by immunoblotting.
-
HSIRT1 KO mESCs have reduced expression of Nanog when cultured in the complete M10 medium. The protein levels of Nanog were analyzed by FACS (n = 3 independent experiments).
SIRT1 is a well‐established cellular metabolic sensor and regulator, we therefore investigated whether metabolic dysregulation plays a role in SIRT1 deficiency‐induced compromise of mESC maintenance. As shown in Figs 2A and EV1A, and Appendix Table S1, a large‐scale unbiased metabolomic analysis of WT and KO mESCs cultured in the M10 medium revealed that methionine, cysteine, SAM, and taurine metabolism was the only amino acid metabolic pathway that was significantly altered in SIRT1 KO mESCs. Further analyses using the pathway enrichment analysis, pathway topology analysis, and metabolite set enrichment analysis of MetaboAnalyst confirmed that one‐carbon metabolism, particularly methionine, cysteine, and taurine metabolism, was the top amino acid metabolic network significantly impacted by loss of SIRT1 in mESCs (Figs 2B and EV1B). Therefore, SIRT1 deficiency in mESCs primarily alters cellular methionine metabolism.
Figure 2. SIRT1 KO mESCs have altered methionine metabolism when cultured in the M10 maintenance medium.
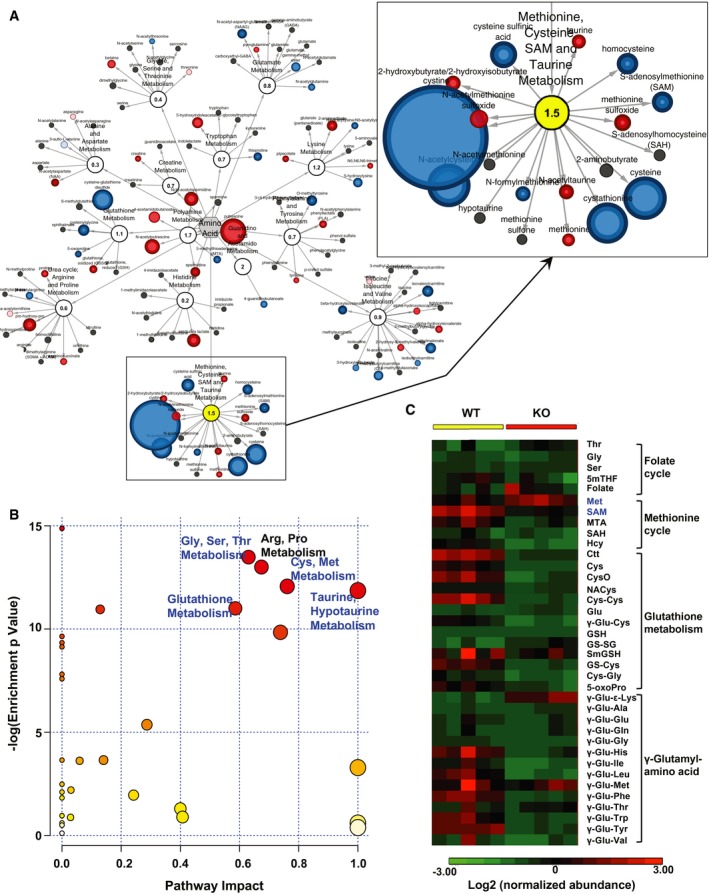
- Alterations in amino acid metabolism in SIRT1 KO versus WT mESCs. WT and SIRT1 KO mESCs were cultured in the M10 medium and analyzed by metabolomics as described in Materials and Methods. The networks of significantly changed metabolites in amino acid metabolism were analyzed by Cytoscape 2.8.3. Metabolites increased in SIRT1 KO mESCs were labeled red (P < 0.05) or pink (0.05 < P < 0.10), and metabolites decreased in SIRT1 KO mESCs were labeled blue (P < 0.05) or light blue (0.05 < P < 0.10). Metabolite node size is proportional to the fold change in KO versus WT (n = 5 independent experiments).
- Significant enrichment of pathways of one‐carbon metabolism in SIRT1 KO versus WT mESCs. WT and SIRT1 KO mESCs were cultured and analyzed by Metabolon as in (A). The metabolites in amino acid metabolism pathways were subjected to the pathway enrichment analysis and the pathway topology analysis in the pathway analysis module of MetaboAnalyst 3.0 (n = 5 independent experiments). Blue, pathways involved in one‐carbon metabolism.
- SIRT1 KO mESCs have altered one‐carbon metabolism and glutathione homeostasis. WT and SIRT1 KO mESCs cultured in M10 medium and the relative abundance of metabolites involved in one‐carbon metabolism was displayed by the heat map (n = 5 independent experiments).
Figure EV1. SIRT1 KO mESCs have altered methionine metabolism and SAM production when cultured in the M10 maintenance medium.
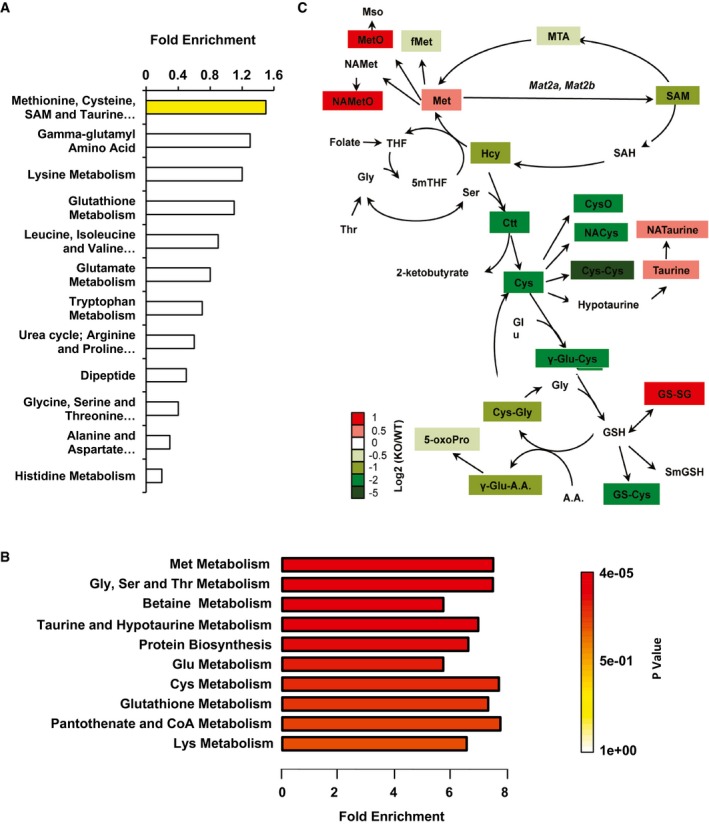
- Significant enrichment of the methionine metabolism pathway in SIRT1 KO versus WT mESCs cultured in the M10 medium. WT and SIRT1 KO mESCs cultured in the complete medium were harvested and subjected to global metabolomic analysis by Metabolon. The fold enrichment of amino acid metabolism pathways was analyzed by Cytoscape 2.8.3 (n = 5 independent experiments). Yellow, P = 0.03.
- Significant enrichment of the methionine metabolism pathway in SIRT1 KO versus WT mESCs cultured in the complete medium. WT and SIRT1 KO mESCs were cultured and analyzed by Metabolon as in (A). The fold enrichment of amino acid metabolism pathways was analyzed by the metabolite set enrichment analysis (MSEA) of MetaboAnalyst 3.0 (n = 5 independent experiments).
- Schematic of one‐carbon metabolism and glutathione homeostasis in SIRT1 KO mESCs relative to WT mESCs in the complete M10 medium. WT and SIRT1 KO mESCs cultured as in (A). The log ratios of the relative abundance of metabolites in indicated pathways in KO/WT mESCs were presented by color scale (n = 5 independent experiments). All colored metabolites were significantly changed in KO mESCs compared to WT mESCs with P < 0.05.
Methionine is an essential amino acid that is critical for protein synthesis, glutathione homeostasis, and DNA and histone methylation (Locasale, 2013). Through the action of methionine adenosyltransferase (MAT), methionine is converted to SAM, the major cellular methyl donor for DNA and histone methyltransferases (Goll & Bestor, 2005; Shi, 2007; Shiraki et al, 2014). S‐adenosylhomocysteine (SAH) generated from the transmethylation reaction is then converted to homocysteine (Hcy) and remethylated back to methionine (Fig EV1C). Hcy can also be converted to cystathionine (Ctt) and cysteine (Cys) and then further used for synthesis of glutathione (GSH). Additionally, SAM can also be enzymatically converted to S‐methyl‐5′‐thioadenosine (MTA) and back to methionine through the methionine salvage pathway (Fig EV1C). Our metabolomic analysis unveiled that SIRT1 KO mESCs cultured in the complete medium displayed significantly elevated levels of methionine and its derivatives but reduced levels of SAM, along with reduced levels of MTA and other metabolites involved in glutathione synthesis (Figs 2C and EV1C), suggesting that SIRT1 KO mESCs have impaired conversion of methionine to SAM in the maintenance medium.
Loss of SIRT1 in mESCs renders specific hypersensitivity to methionine depletion/restriction‐induced differentiation and apoptosis
Methionine depletion in human ESCs has been shown to induce differentiation along with stress responses and massive cell death (Shiraki et al, 2014). In line with our observation that SIRT1 deficiency disrupts methionine metabolism (Fig 2), methionine deprivation‐induced cell death and morphological changes were more evident in SIRT1 KO mESCs than in WT mESCs (Fig EV2A, ‐Met). Consistently, SIRT1 KO mESCs had elevated expression levels of several ESC differentiation markers, including Nestin, Cdx1, Cdx2, and Sox17, along with reduced levels of a stem cell marker Nanog, particularly when cultured in the methionine‐free medium (Fig EV2B). In contrast, depletion of a few control amino acids as well as several other key amino acids that have been previously shown to be important for ESC self‐renewal and pluripotency (Wang et al, 2009; Dang, 2012; Folmes et al, 2012; Ward & Thompson, 2012; Carey et al, 2015) either only had modest effects on mESC morphology or AP staining intensity (Fig EV2A, ‐Gln or ‐Leu) or led to significant cell death and decreased cell number, but to comparable extents in both WT and SIRT1 KO mESCs (Fig EV2A, ‐Thr, ‐Arg, ‐Lys, or ‐Cys). Similar specificity to methionine depletion was also observed in sh‐SIRT1 mESCs (Appendix Fig S2A). Therefore, SIRT1‐deficient mESCs were specifically hypersensitive to methionine depletion‐induced differentiation and apoptosis.
Figure EV2. SIRT1 KO mESCs are sensitive to methionine depletion‐induced differentiation.
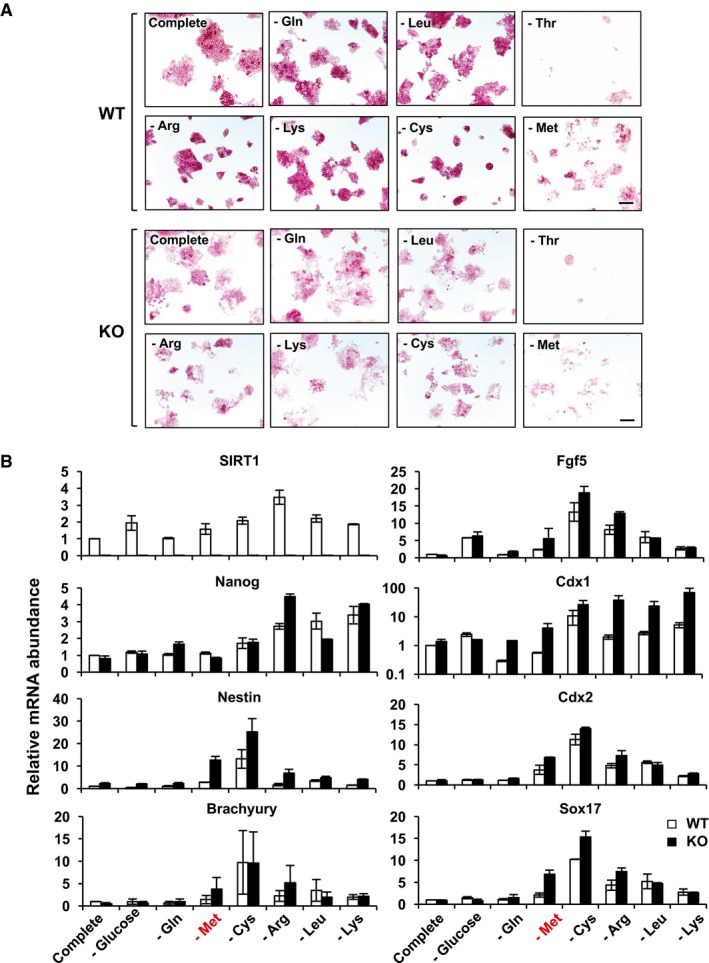
- SIRT1 KO mESCs display enhanced differentiation phenotypes in a methionine‐free M10 medium. WT and KO mESCs were cultured in the complete M10 medium or modified M10 media depleted the indicated nutrients for 48 h. Cells were stained for the AP activities. Scale bars, 100 μm.
- Relative mRNA expression of stem cell marker and differentiation markers in WT and KO mESCs cultured in indicated nutrient‐deprived medium. WT and KO mESCs cultured in indicated media for 48 h were harvested, and the relative mRNA levels of different markers were analyzed by qPCR. Please note that methionine depletion induced higher expression levels of all tested differentiation markers in KO than in WT mESCs (n = 3 independent experiments). Data are presented as mean ± SEM.
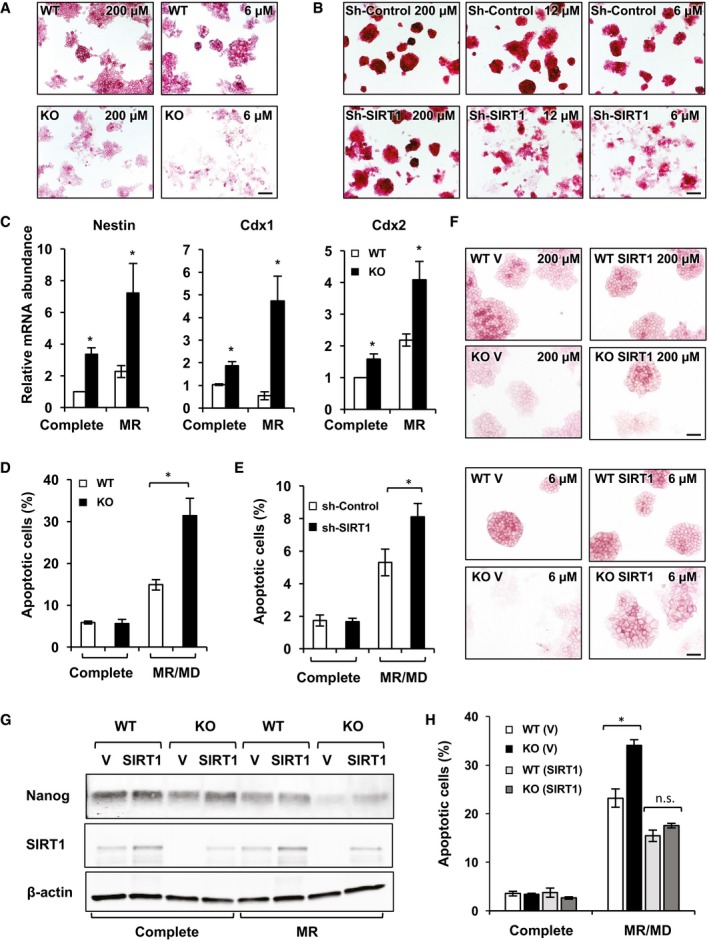
The complete M10 medium contains 200 μM methionine, and methionine depletion led to differentiation and massive cell death in both control and SIRT1‐deficient mESCs (Fig EV2A and Appendix Fig S2A, ‐Met). To dissect the involvement of SIRT1 in methionine‐mediated metabolic regulation of maintenance of mESC pluripotency while reducing the effect of methionine depletion‐induced stress responses and cell death, we titrated methionine concentrations in the M10 medium and determined that the optimal methionine concentration range that allowed the best detection of the difference between controls and SIRT1‐deficient mESCs was 6–12 μM (Appendix Figs S2B and S3A and B). Restriction of methionine from 200 μM to this concentration range did not induce significant apoptosis (Appendix Fig S3C) and only had modest impact on mESC morphology and AP staining intensities in WT or sh‐Control mESCs (Fig 3A and B). However, SIRT1 KO and sh‐SIRT1 mESCs were significantly more differentiated after methionine restriction (Fig 3A and B). Consistently, methionine restriction markedly induced the expression of ESC differentiation markers Nestin, Cdx1, and Cdx2 in SIRT1 KO mESCs but only modestly in WT mESCs (Fig 3C). Further analyses revealed that 24‐h methionine restriction followed by overnight methionine deprivation (labeled as MR/MD) induced significantly more apoptotic cells in SIRT1‐deficient cells than in control mESCs (Fig 3D and E). Importantly, re‐expression of SIRT1 in SIRT1 KO mESCs rescued SIRT1 deficiency‐induced loss of pluripotency (Fig 3F and G) and repressed methionine restriction/deprivation‐induced apoptosis in both WT and KO mESCs (Fig 3H), indicating that the observed compromise of mESC maintenance in SIRT1 KO mESCs is due to loss of SIRT1. Moreover, adding back methionine in the methionine‐deprived M10 medium dose‐dependently rescued SIRT1 deficiency resulted reduction in mESC maintenance (Appendix Fig S4). Taken together, these data indicate that SIRT1 is specifically involved in methionine‐mediated maintenance of mESCs.
Figure 3. SIRT1‐deficient mESCs are sensitive to methionine restriction‐induced loss of pluripotency and apoptosis.
-
ASIRT1 KO mESCs exhibit a reduced AP staining intensity when cultured in a M10 medium containing 6 μM methionine. WT and KO mESCs were cultured in the complete M10 medium (contains 200 μM methionine) or a M10 medium containing 6 μM methionine for 48 h (images of WT and KO mESCs cultured in M10 medium containing 6 μM methionine are also displayed in Appendix Fig S3A). Scale bar, 100 μm.
-
Bsh‐SIRT1 mESCs are sensitive to methionine restriction‐induced differentiation. Sh‐Control and sh‐SIRT1 mESCs were cultured in the complete M10 medium (contains 200 μM methionine) or a M10 medium containing 12 or 6 μM methionine for 48 h (images are also displayed in Appendix Fig S2B). Scale bar, 100 μm.
-
CSIRT1 KO mESCs exhibit increased expression levels of ESC differentiation markers in the methionine‐restricted medium compared to WT mESCs. WT and SIRT1 KO mESCs were cultured in the complete M10 medium or a M10 medium containing 6 μM methionine for 48 h (n = 3 independent experiments).
-
D, EMethionine restriction followed by deprivation leads to elevated cell apoptosis in SIRT1 KO mESCs (D) or sh‐SIRT1 mESCs (E) compared to control mESCs. Control and SIRT1‐deficient mESCs cultured in complete medium for 40 h, or in methionine‐restricted medium for 24 h followed by methionine‐free medium for additional 16 h (n = 3 independent experiments).
-
F, GSIRT1 re‐expression rescues SIRT1 deficiency‐induced loss of pluripotency. WT and SIRT1 KO mESCs stably infected with lentiviruses containing the empty vector (V) or a construct expressing SIRT1 (SIRT1) were cultured in complete or methionine‐restricted medium for 48 h. The cells were stained for the AP activities (F) and the total cell lysates were blotted with Nanog antibodies (G). Scale bars in (F), 100 μm.
-
HSIRT1 re‐expression rescues SIRT1 deficiency‐induced apoptosis in response to methionine restriction. WT and SIRT1 KO mESCs stably infected with lentiviruses containing the empty vector (V) or a construct expressing SIRT1 (SIRT1) were cultured as in (D and E) (n = 3 independent experiments).
Loss of SIRT1 reduces cellular SAM abundance and histone methylation levels and alters global gene expression profiles in mESCs
To investigate whether WT and SIRT1 KO mESCs have distinct responses to methionine restriction at the metabolic level, we subjected WT and SIRT1 KO mESCs cultured in methionine‐restricted medium for metabolomic analyses. As shown in Fig 4A and B, methionine restriction for 6 h reduced both cellular methionine and SAM contents; but SIRT1 KO mESCs still accumulated significantly higher amounts of methionine and its derivatives while depleting SAM and other metabolites involved in glutathione synthesis. Targeted analyses of several key metabolites in the methionine cycle by liquid chromatography/mass spectrometry (LC/MS) confirmed that SIRT1 KO mESCs cultured in the complete medium displayed significantly elevated levels of methionine but reduced levels of SAM, MTA, and GSH. Again, SIRT1 KO mESCs had increased methionine yet decreased SAM and GSH compared to WT mESCs even after 24‐h methionine restriction (Fig 4C). It is worth noting that SIRT1 KO mESCs cultured in complete medium (containing normal levels of methionine) had SAM levels similar to those of WT mESCs after methionine restriction (Fig 4A and C, SAM), suggesting that SIRT1 KO mESCs are experiencing methionine restriction even when cultured in the complete medium.
Figure 4. SIRT1 KO mESCs have altered methionine metabolism and SAM production in both complete and methionine‐restricted media.
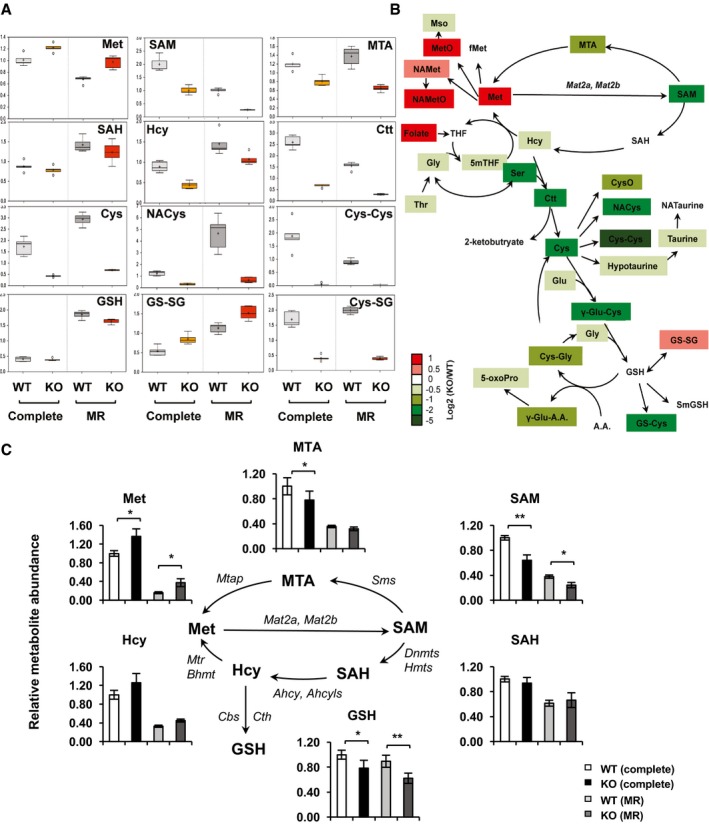
- SIRT1 KO mESCs have altered one‐carbon metabolism and glutathione homeostasis. WT and SIRT1 KO mESCs cultured in the complete medium or methionine‐restricted medium for 6 h. The relative abundance of key metabolites in methionine cycle and glutathione metabolism was represented by box plots (n = 5 independent experiments). Horizontal lines: median value; crosses: mean value; box limits: limits of upper or lower quartile; whiskers: max or min of distribution; circles: extreme data points.
- Schematic of one‐carbon metabolism and glutathione homeostasis in SIRT1 KO mESCs relative to WT mESCs in methionine‐restricted medium. WT and SIRT1 KO mESCs cultured as in (A). The log ratios of the relative abundance of metabolites in indicated pathways in KO/WT mESCs were presented by color scale. All colored metabolites were significantly changed in KO mESCs compared to WT mESCs with P < 0.05 (n = 5 independent experiments).
- The conversion of methionine to SAM is reduced in SIRT1 KO mESCs. WT and SIRT1 KO mESCs cultured in complete medium or methionine‐restricted medium for 24 h. The relative abundance of indicated methionine‐related metabolites was analyzed by targeted LC/MS (n = 5 independent experiments). Data are presented as mean ± SEM. *P < 0.05, **P < 0.01 (Mann–Whitney test).
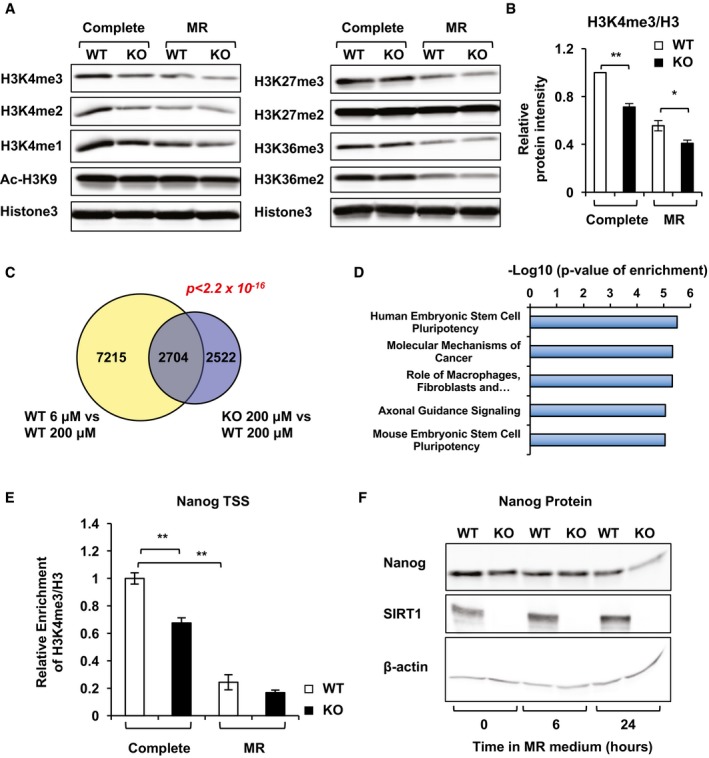
Alterations in cellular SAM concentrations have been shown to influence histone methylation in both mESCs and hESCs (Shyh‐Chang et al, 2013a; Shiraki et al, 2014). Methionine cycle dynamics can quantitatively and reversibly affect cellular SAM/SAH ratio, thereby impacting histone methylation levels/patterns and altering gene expression (Mentch et al, 2015; Mentch & Locasale, 2016). Consistent with this notion, many histone methylation marks that have been previously shown to be sensitive to methionine deprivation/restriction were significantly reduced in SIRT1 KO mESCs even when cultured in the complete medium (Fig 5A), suggesting that the reduced SAM levels in SIRT1 KO mESCs affect histone methylation. Particularly, H3K4me3 levels in SIRT1 KO mESCs cultured in the complete medium were reduced to an extent comparable to those of methionine‐restricted WT mESCs (Fig 5A and B). As a control, the levels of acetyl‐H3K9, a well‐established deacetylation substrate of SIRT1 in many cell types, were not significantly affected by either methionine restriction or SIRT1 deletion in mESCs (Fig 5A, Ac‐H3K9). This observation suggests a unique role of SIRT1 in epigenetic regulation of mESCs.
Figure 5. Deletion of SIRT1 in mESCs reduces levels of H3K4 methylation and alters global gene expression profiles.
-
A, BSIRT1 KO mESCs have reduced methylation levels of H3K4 in both complete medium and methionine‐restricted medium. Total histones were acid‐extracted from WT and SIRT1 KO mESCs cultured in the complete medium or methionine‐restricted medium for 24 h. The relative intensities of H3K4me3 were quantified in ImageJ (n = 3 independent experiments).
-
CVenn‐diagram representation of the subset of genes that were significantly altered by more than 1.5‐fold upon methionine restriction in WT mESCs or by deletion of SIRT1 in the complete medium. P < 2.2 × 10⁻¹⁶ by Fisher's exact test.
-
DPathways involved in the maintenance of ESC pluripotency are enriched in the 1,614 genes highlighted in the blue boxes in Fig EV3E. The 1,614 gene probes were analyzed by Ingenuity Pathway Analysis (IPA), and the top five canonical pathways with the enrichment P‐values were displayed.
-
ESIRT1 KO mESCs have reduced H3K4me3 levels on the TSS of Nanog in the complete medium (n = 3 independent experiments).
-
FSIRT1 deletion and/or methionine restriction reduce expression of Nanog protein.
To further assess the functional impact of the alterations in histone methylation in SIRT1 KO mESCs, we determined the transcriptomes of WT and SIRT1 KO mESCs cultured in the complete or methionine‐restricted medium for 6, 24, or 72 h (Fig EV3). Not surprisingly, methionine restriction or SIRT1 deletion induced changes in several thousand genes at all these time points (Fig EV3A and B), and WT and SIRT1 KO mESCs had distinct transcriptional responses to methionine restriction (Fig EV3C). Specifically, at the 24‐h time point, methionine restriction in WT mESCs altered the expression levels of 9,919 gene probes, whereas deletion of SIRT1 led to changes in 5,226 gene probes (Fig EV3D). Notably, these two expression profiles significantly overlapped with 2,704 gene probes in common (P < 2.2 × 10⁻¹⁶) (Fig 5C and Appendix Table S2), supporting the notion that SIRT1 deletion partially mimics methionine restriction in mESCs. Further heat map and Ingenuity Pathway Analysis (IPA) indicated 1,614 out of the 2,704 common genes (60%) were altered to the same direction by both methionine restriction and SIRT1 deletion (Fig EV3E, blue boxes), and this 1,614‐gene list was enriched in pathways involved in regulation of ESC pluripotency (Fig 5D), suggesting that defective methionine metabolism is one of the major underlying mechanisms for SIRT1 deficiency‐induced reduction in ESC pluripotency. Consistent with this possibility, the relative H3K4me3 levels on the transcription starting site (TSS) of Nanog gene (Fig 5E) and the Nanog expression (Fig 5F) were significantly reduced by both SIRT1 deletion and methionine restriction. Collectively, our findings suggest that SIRT1 regulates the conversion of methionine to SAM, thereby modulating histone methylation levels and gene expression profiles, and eventually influencing maintenance of pluripotent mESCs.
Figure EV3. Deletion of SIRT1 in mESCs alters global gene expression profiles.
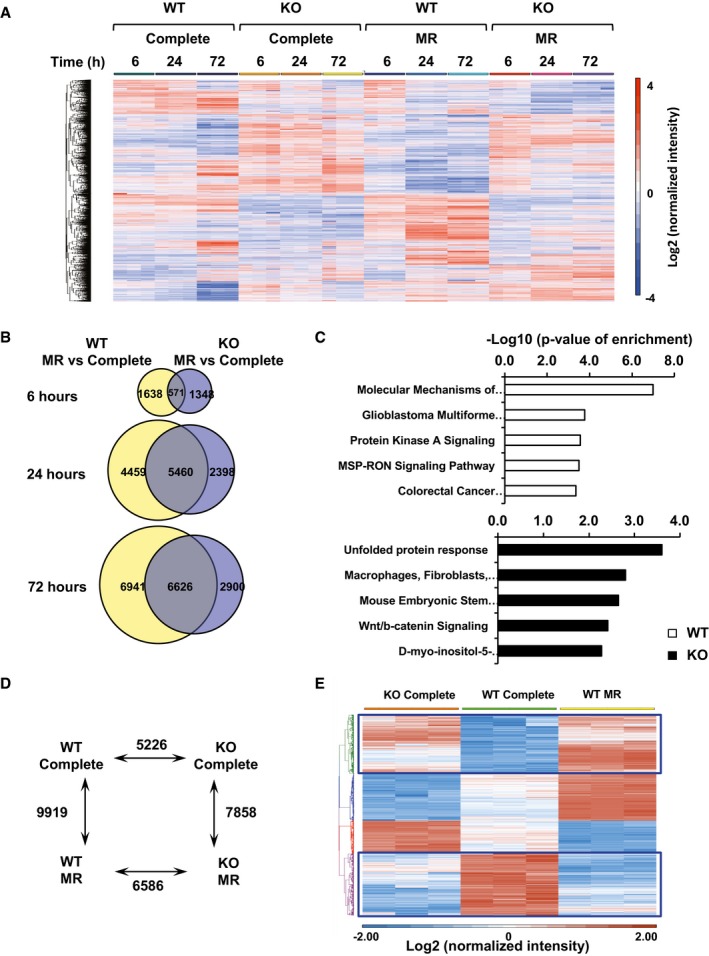
- The mRNA expression profiles of WT and SIRT1 KO mESCs cultured in the complete medium or methionine‐restricted medium for 6, 24, or 72 h. The mRNAs were analyzed by the mouse whole‐genome microarrays as described in Materials and Methods (n = 3 independent experiments, adjusted P < 0.05, cutoff fold changes: 1.5).
- Venn‐diagram representation of the genes that were significantly altered by more than 1.5‐fold upon methionine restriction for indicated times in WT and SIRT1 KO mESCs.
- WT and SIRT1 KO mESCs have distinct transcriptional responses to methionine restriction. WT and SIRT1 KO mESCs cultured in the complete medium or methionine‐restricted medium for 6 h. Unique gene lists from WT (1,638) and SIRT1 iKO (1,348) mESCs were analyzed by the IPA software, and the top five canonical pathways in each gene list were listed (n = 3 independent experiments, adjusted P < 0.05, cutoff fold changes: 1.5).
- The numbers of differentially expressed gene probes between WT and SIRT1 KO mESCs cultured in the complete medium or methionine‐restricted medium for 24 h (n = 3 independent experiments, adjusted P < 0.05, cutoff fold changes: 1.5).
- The mRNA levels of 2,704 overlapped genes were presented by heatmaps. Please note that 1,614 out of these overlapped genes were altered in the same direction by SIRT1 deletion or methionine restriction in mESCs (genes inside the blue boxes).
SIRT1 promotes SAM production in part through Myc‐mediated expression of MAT2 enzymes
In ESCs, conversion of methionine to SAM is catalyzed by MAT2, a ubiquitously expressed oligomeric methionine adenosyltransferase consisting of α and β subunits (Halim et al, 1999; Shiraki et al, 2014). In line with the reduced cellular SAM levels (Figs 2 and 4), the mRNA levels of both Mat2a and Mat2b were significantly reduced in SIRT1 KO mESCs in the complete medium (Figs 6A and EV4A). Methionine restriction induced the expression of Mat2a mRNA and protein in WT mESCs, but this induction was significantly decreased in the SIRT1 KO mESCs (Figs 6A and B, and EV4B). Consistently, the activity of Mat2a was significantly reduced in SIRT1 KO mESCs in both complete and methionine‐restricted medium (Fig EV4C). Moreover, re‐expression of SIRT1 rescued the blunted induction of Mat2a mRNA and protein in SIRT1 KO mESCs in response to methionine restriction (Figs 6C and EV4D). Therefore, SIRT1 is crucial in promoting the expression of Mat2 in response to methionine restriction.
Figure 6. SIRT1 promotes conversion of methionine to SAM through Mat2a.
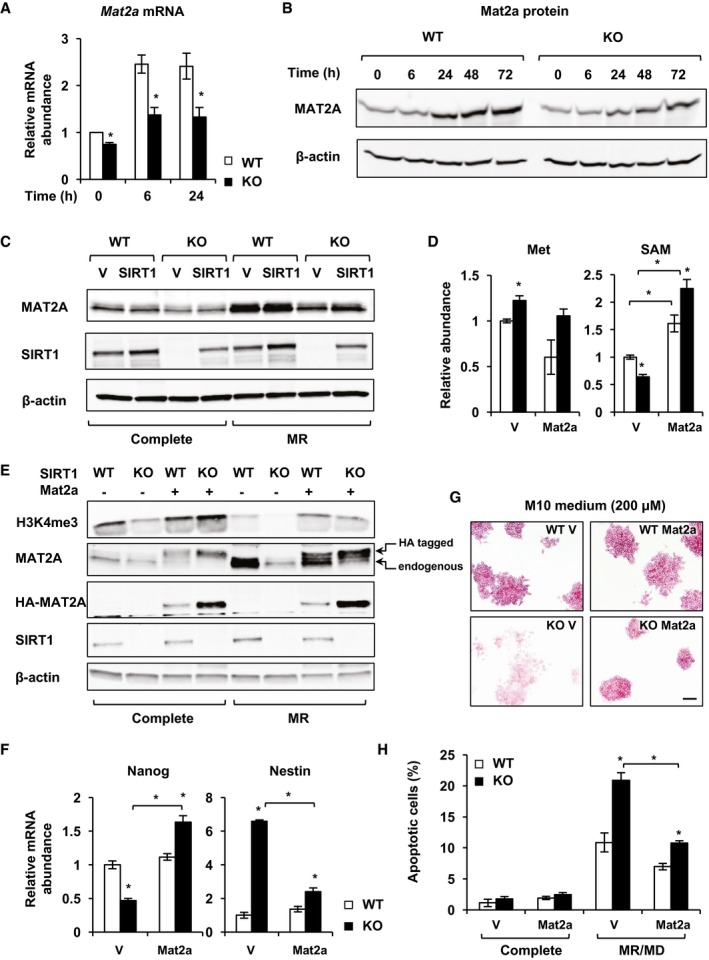
- SIRT1 KO mESCs display reduced expression of Mat2a enzymes (n = 3 independent experiments).
- SIRT1 KO mESCs have reduced induction of MAT2A protein in response to methionine restriction.
- SIRT1 re‐expression rescues SIRT1 deficiency‐induced reduction in Mat2a protein. WT and SIRT1 KO mESCs stably infected with lentiviruses containing the empty vector (V) or a construct expressing SIRT1 (SIRT1) were cultured in complete or methionine‐restricted medium for 24 h. The total cell lysates were blotted with indicated antibodies.
- Overexpression of exogenous Mat2a increases SAM production in mESCs. WT and SIRT1 KO mESCs were infected with lentiviruses containing either empty vector (V) or mouse Mat2a gene (Mat2a). Stable clones were selected and cultured in the complete M10 medium, and the intracellular concentrations of methionine (Met) and SAM were measured by LC‐MS (n = 3 independent clones).
- Overexpression of exogenous Mat2a rescues SIRT1 deletion‐induced reduction in H3K4me3 levels.
- Overexpression of exogenous Mat2a induces Nanog while repressing Nestin in SIRT1 KO mESCs (n = 3 independent clones).
- Overexpression of exogenous Mat2a rescues SIRT1 deletion‐induced mESC differentiation in M10 medium. Scale bar, 100 μm.
- Overexpression of exogenous Mat2a rescues methionine restriction/deprivation‐induced cell apoptosis in SIRT1 KO mESCs (n = 3 independent clones).
Figure EV4. SIRT1 promotes conversion of methionine to SAM through Mat2a.
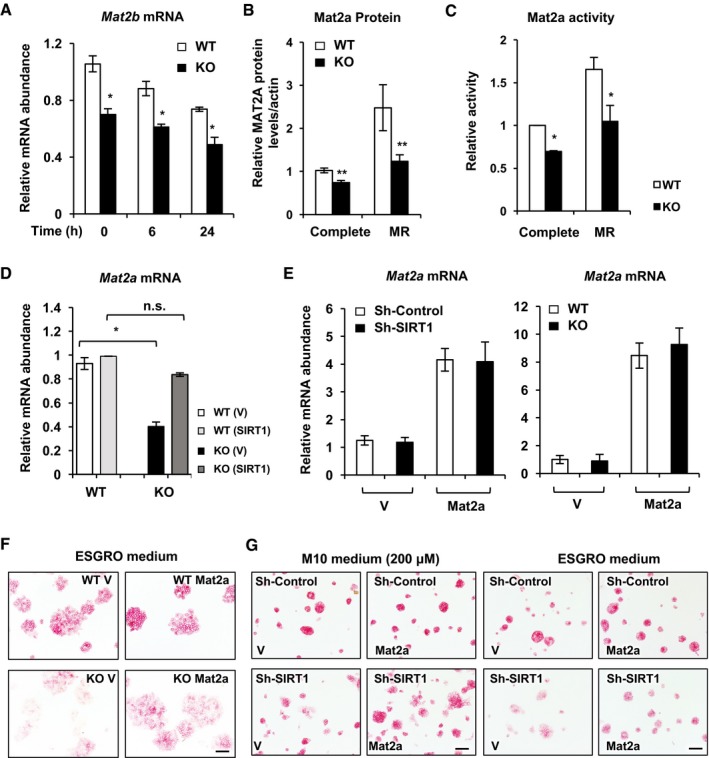
- SIRT1 KO mESCs display reduced expression of Mat2b enzymes (n = 3 independent experiments).
- SIRT1 KO mESCs have reduced protein levels of MAT2A in both complete and methionine‐restricted medium. WT and SIRT1 KO mESCs were cultured in complete or methionine‐restricted medium (MR) for 24 h. The relative intensities of MAT2A were quantified using ImageJ (n = 5 independent experiments).
- SIRT1 KO mESCs have reduced Mat2a activities in both complete and methionine‐restricted medium. WT and SIRT1 KO mESCs were cultured in complete or methionine‐restricted medium (MR) for 24 h, and the activities were measured as described in Materials and Methods (n = 3 independent experiments).
- SIRT1 re‐expression rescues SIRT1 deficiency‐induced reduction in Mat2a mRNA. WT and SIRT1 KO mESCs stably infected with lentiviruses containing the empty vector (V) or a construct expressing SIRT1 (SIRT1) were cultured in complete or methionine‐restricted medium for 48 h (n = 3 independent experiments).
- Overexpression of Mat2a in mESCs. Control and SIRT1‐deficient mESCs were infected with lentiviruses containing either empty vector or mouse Mat2a gene. Stable lines were selected and analyzed for the mRNA levels of Mat2a by qPCR (n = 3 independent experiments).
- Overexpression of exogenous Mat2a rescues SIRT1 deletion‐induced mESC differentiation in ESGRO mESC maintenance medium. WT and SIRT1 KO mESCs were stably infected with lentiviruses containing either empty vector or mouse Mat2a gene and cultured in the ESGRO maintenance medium. Scale bars, 100 μm.
- Overexpression of exogenous Mat2a rescues SIRT1 deficiency‐induced mESC differentiation in complete M10 medium and ESGRO maintenance medium. Sh‐Control and sh‐SIRT1 mESCs were stably infected with lentiviruses containing either empty vector or mouse Mat2a gene and cultured in the complete M10 medium or ESGRO maintenance medium. Scale bars, 100 μm.
To evaluate the contribution of the reduced expression/induction of Mat2a in SIRT1 deficiency‐induced loss of mESC maintenance, we stably infected control and SIRT1‐deficient mESCs with lentiviruses containing either the empty vector (V) or a construct expressing mouse Mat2a gene (Mat2a) (Fig EV4E). As shown in Fig 6D, stable overexpression of Mat2a significantly increased the intracellular levels of SAM in both WT and SIRT1 KO mESCs cultured in the complete medium. Consistently, Mat2a overexpression increased H3K4me3 levels (Fig 6E) and induced mRNA levels of Nanog while reducing Nestin (Fig 6F) in SIRT1 KO mESCs. Moreover, overexpression of Mat2a rescued SIRT1 deficiency‐induced differentiation morphology in two different mESC maintenance media (Figs 6G and EV4F and G) and reduced methionine restriction/deprivation‐induced cell apoptosis (Fig 6H), further highlighting the importance of Mat2 in SIRT1‐mediated maintenance of mESCs.
Further promoter analyses using the tool “Match” from Biobase TRANSFAC revealed that promoters of both Mat2a and Mat2b genes contained several binding sites for two closely related key transcriptional regulators in ESCs, N‐Myc and c‐Myc (Appendix Fig S5A), many of which have been previously identified in N‐Myc and c‐Myc ChIP‐seq studies performed in mESCs (Chen et al, 2008; Kidder et al, 2008; Kim et al, 2008). Between these two Myc proteins, c‐Myc is a known SIRT1 deacetylation substrate, and deacetylation of c‐Myc by SIRT1 has been reported to increase its stability and activity (Menssen et al, 2012). N‐Myc has been shown to induce SIRT1 expression, which in turn enhances N‐Myc stability during oncogenesis (Marshall et al, 2011). However, although c‐Myc is well known for its ability to enhance glycolysis and glutamine catabolism (Dang et al, 2009), the function of these two Myc proteins in regulation of cellular methionine metabolism has not yet been studied.
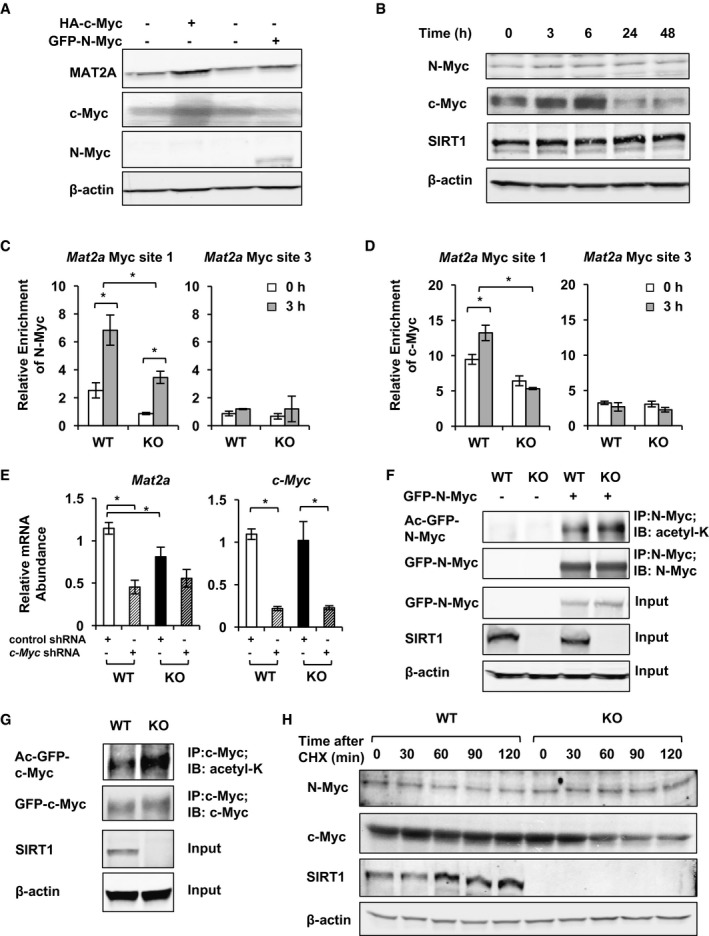
To test whether two Myc proteins play a role in conversion of methionine to SAM, we cloned luciferase reporters driven by different pieces of the mouse Mat2a promoter, then co‐expressed them with N‐Myc and/or c‐Myc in HEK293T cells. Co‐expression of N‐Myc protein markedly increased the luciferase activities from reporters driven by the Mat2a promoters that contain the Myc binding site 1 (Appendix Fig S5B). Co‐expression of c‐Myc enhanced the luciferase activities modestly, whereas co‐expression of CNOT3, another factor that has a predicted binding site on the Mat2a promoter, completely failed to promote the luciferase activities (Appendix Fig S5B). Consistently, overexpression of c‐Myc or N‐Myc protein increased the protein levels of MAT2A in mESCs (Fig 7A). These findings indicate that Myc proteins are capable of promoting the expression of MAT2A primarily through the Myc binding site 1 on the Mat2a promoter. In supporting of this notion, both N‐Myc and c‐Myc proteins were quickly induced (Fig 7B) and recruited to the Myc binding site 1 on the Mat2a promoter (Fig 7C and D) upon methionine restriction in WT mESCs. However, the binding of Myc proteins to the Myc site 1 was reduced in KO mESCs cultured either in the complete medium or upon methionine restriction (Fig 7C and D), suggesting that reduced binding and recruitment of Myc proteins to the Mat2a promoter may be accountable for decreased expression of Mat2a in SIRT1 KO mESCs. To further evaluate the importance of Myc proteins in methionine restriction‐induced expression of Mat2a, we knocked down c‐Myc (Fig 7E) or N‐Myc proteins (Appendix Fig S5C) in mESCs using RNA interference. As shown in Fig 7E, knocking down c‐Myc significantly reduced the mRNA levels of Mat2a in WT mESCs in complete medium. Knocking down N‐Myc, on the other hand, significantly blunted the induction of MAT2A expression upon methionine restriction (Appendix Fig S5C and D) and reduced maintenance of pluripotency in WT mESCs (Appendix Fig S5E). Together, these observations indicate that defective transaction activity of Myc proteins is a prime reason for reduced Mat2a levels in SIRT1‐deficient mESCs.
Figure 7. SIRT1 induces expression of Mat2a in part through Myc.
-
AOverexpression of Myc induces expression of MAT2A protein in WT mESCs.
-
BThe protein levels of N‐Myc and c‐Myc are induced by methionine restriction in mESCs. The protein levels of N‐Myc, c‐Myc, and SIRT1 were analyzed at different time points after methionine restriction.
-
C, DSIRT1 KO mESCs have reduced association of N‐Myc (C) and c‐Myc (D) with the Myc binding site 1 on the promoter of Mat2a genes. WT and SIRT1 KO mESCs were cultured in the methionine‐restricted medium for indicated times, and the binding of N‐Myc and c‐Myc to the Mat2a promoter was analyzed by chromatin immunoprecipitation (n = 3 independent experiments).
-
EKnocking down of c‐Myc protein blunts the induction of Mat2a expression upon methionine restriction in mESCs (n = 3 independent experiments).
-
FGFP‐tagged N‐Myc protein is hyperacetylated in SIRT1 KO mESCs.
-
GGFP‐tagged c‐Myc protein is hyperacetylated in SIRT1 KO mESCs.
-
HEndogenous c‐Myc protein is less stable in SIRT1 KO mESCs. WT and SIRT1 KO mESCs cultured in the methionine‐restricted medium were treated with 100 μg/ml cycloheximide (CHX) for indicated times, and the levels of endogenous N‐Myc and c‐Myc proteins were analyzed by immunoblotting.
To further understand how SIRT1 regulates the transactivation activity of Myc proteins, we tested the possibility that both N‐Myc and c‐Myc are SIRT1 deacetylation substrates in mESCs. As shown in Fig 7F and G, and Appendix Fig S5F, GFP‐tagged N‐Myc, GFP‐tagged c‐Myc, and the endogenous c‐Myc proteins were hyperacetylated in SIRT1 KO mESCs. Additionally, consistent with the report that acetylation of c‐Myc decreases its stability and activity (Menssen et al, 2012), endogenous c‐Myc was less stable in SIRT1 KO mESCs (Fig 7H). Taken together, all these data support the notion that SIRT1 promotes SAM production through, at least in part, Myc‐mediated transcriptional activation of Mat2.
Maternal methionine restriction increases lethality of SIRT1 KO embryos, whereas maternal methionine supplementation increases the survival of SIRT1 KO newborn mice
To assess the importance of methionine to SAM conversion in SIRT1‐regulated epigenetic homeostasis and embryogenesis in vivo, we investigated whether embryonic SIRT1 deficiency is associated with altered Mat2 expression and histone methylation in mice. As shown in Fig 8A, in mouse embryos at embryonic day (E)8.5, the mRNA levels of both Mat2a and Mat2b were positively correlated with the mRNA abundance of Sirt1. Particularly, many E8.5 SIRT1 KO embryos displayed marked reduction in expression of Mat2 genes (Fig EV5A), MAT2A protein (Fig 8B), and H3K4me3 levels (Fig 8B), raising the possibility that SIRT1 KO embryos may be sensitive to maternal methionine restriction (MR). To test this possibility, we subjected dams from SIRT1 heterozygous breeding pairs to methionine restriction by feeding them with a methionine‐deficient diet starting at gestation day 0.5, followed by analyzing the embryonic development and survival in embryos from E8.5 to E14.5. MR diet feeding from E0.5 did not significantly alter the litter size (Fig EV5B). As expected, SIRT1 protein was highly expressed in E8.5 WT embryonic tissues (arrowheads), and this expression was completely absent in E8.5 SIRT1 KO embryos (Fig 8C). Interestingly, E8.5–9.5 SIRT1 KO embryos on the C57BL/6J background displayed minimal developmental defects compared to WT embryos when bred under the chow diet (Fig EV5C). However, they had detectable developmental defects and growth retardation upon maternal methionine restriction (Fig 8D). Consistently, SIRT1 KO embryos survived through the E8.5–E14.5 stages with an expected Mendelian ratio of 24.6% under the chow diet, but only 13.6% of all survived embryos were SIRT1 KO at the same developmental stages upon maternal methionine restriction (Figs 8E and EV5D, and Appendix Table S3), which was significantly below the expected 25% (P = 0.033, Pearson's chi‐square goodness‐of‐fit test). This observation indicated that methionine restriction selectively reduces the survival rate of SIRT1 KO embryos.
Figure 8. Maternal methionine restriction increases lethality of SIRT1 KO embryos, whereas maternal methionine supplementation increases the survival of SIRT1 KO newborn mice.
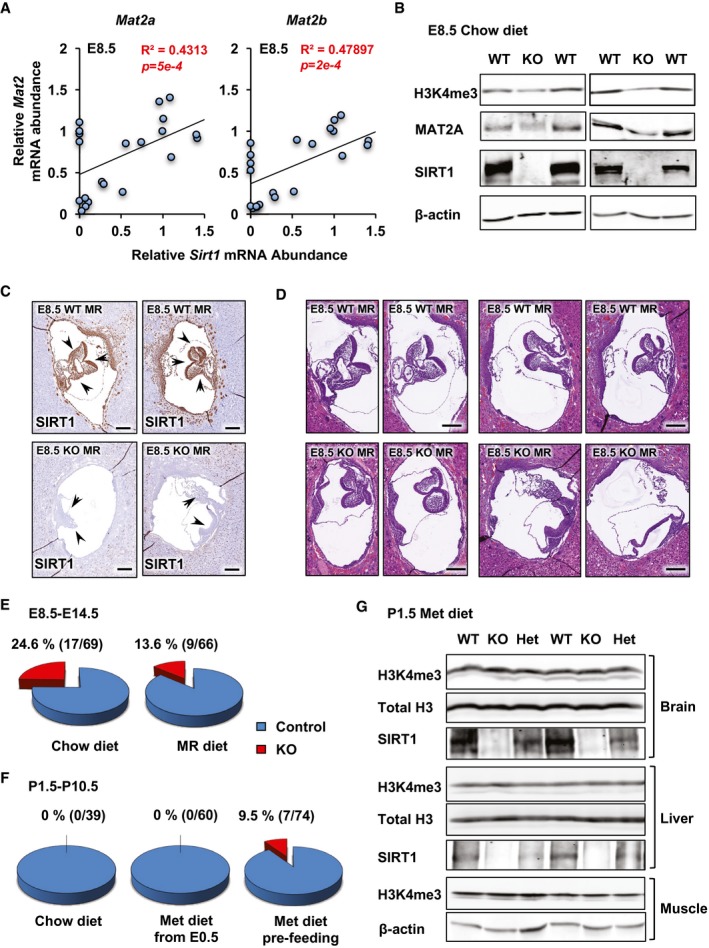
- Positive correlation between mRNA levels of SIRT1 and Mat2 in E8.5 embryos (n = 24, analyzed by Pearson's correlation test).
- SIRT1 KO E8.5 embryos have reduced levels of H3K4me3 and MAT2A proteins.
- Loss of SIRT1 protein in SIRT1 KO E8.5 embryos. Uteri from dams at E8.5 were fixed and embedded. Sections of embryos were stained with an anti‐SIRT1 antibody (brown). Arrow heads, E8.5 embryos inside the uterus. Please note that SIRT1 is highly expressed in embryonic tissues in WT embryos. Scale bars, 200 μm.
- Maternal methionine restriction enhances developmental defects and growth retardation in SIRT1 KO E8.5 embryos. H&E staining of sections from WT and SIRT1 KO E8.5 embryos. Scale bars, 200 μm.
- SIRT1 KO E8.5–E14.5 embryos have a significantly reduced survival rate under maternal methionine restriction. Maternal methionine restriction was performed from E0.5 as described in Materials and Methods. Compared to the expected 25% Mendelian ratio from heterozygous breeding pairs, SIRT1 KO embryos had a normal survival rate under maternal chow diet feeding (P = 0.9438), and this rate dropped significantly upon maternal methionine restriction (P = 0.033). Data were analyzed by Pearson's chi‐square goodness‐of‐fit test. Please also see Fig EV5 and Appendix Table S3.
- SIRT1 KO newborn pups have significantly increased survival after maternal methionine supplementation (P < 2.2 × 10⁻¹⁶, Pearson's chi‐square goodness‐of‐fit test). Maternal methionine supplementation was performed in females at E0.5 or 3–4 weeks before pregnancy (pre‐feeding), and the survival of newborn pups was monitored as described in Materials and Methods. Please also see Fig EV5 and Appendix Table S4.
- SIRT1 KO newborn pups have normal levels of H3K4me3 after maternal methionine supplementation. Maternal methionine supplementation was performed in mothers 3–4 weeks before pregnancy as described in Materials and Methods, and H3K4me3 levels were analyzed in surviving P1.5 pups.
Source data are available online for this figure.
Figure EV5. Maternal methionine restriction increases lethality of SIRT1 KO embryos, whereas maternal methionine supplementation increases the survival of SIRT1 KO newborn mice.
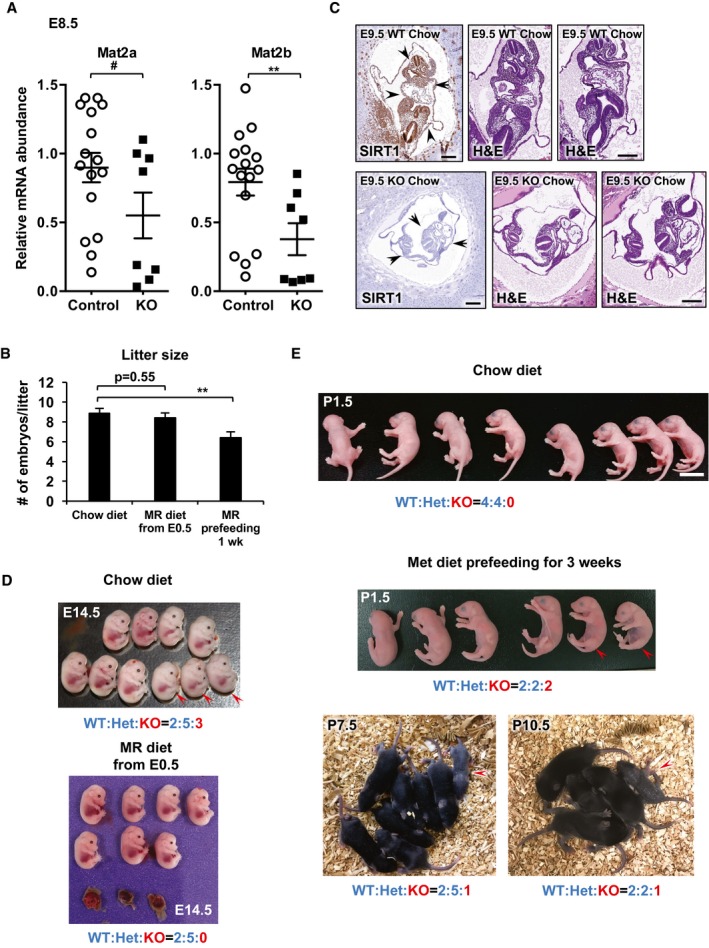
- SIRT1 KO E8.5 embryos have reduced expression levels of Mat2a and Mat2b (n = 16 control and 8 SIRT1 KO embryos).
- Maternal methionine restriction from E0.5 does not affect litter size. Female SIRT1 heterozygous breeders were fed with either chow diet (n = 7), methionine‐restricted diet (MR) from E0.5 (n = 7), or pre‐fed with MR diet for 1 week (n = 10). Litter size was analyzed from E8.5–E14.5 embryos.
- WT and SIRT1 KO E9.5 embryos under chow. Scale bars, 200 μm. Black arrows indicate the location of embryo.
- SIRT1 KO E8.5–E14.5 embryos have reduced survival under maternal methionine restriction from E0.5. Arrow heads, SIRT1 KO embryos. The viability of E8.5–E14.5 embryos was analyzed as described in Materials and Methods.
- SIRT1 KO newborn pups have increased survival after maternal methionine supplementation. Arrow heads, SIRT1 KO newborns. The survival of PND1.5–10.5 newborn pups was analyzed as described in Materials and Methods. Scale bar, 1 cm.
To further evaluate the role of the reduced conversion of methionine to SAM in SIRT1 deficiency‐induced developmental defects, we tested whether maternal supplementation of metabolites in the methionine metabolism pathway could overcome, at least in part, some congenital abnormalities observed in SIRT1 KO mice. We were unable to directly supplement SAM due to its poor membrane permeability to mammalian cells and low stability (McMillan et al, 2005). However, the reduced but not completely blocked conversion of methionine to SAM in SIRT1 KO mESCs suggests that maternal methionine supplementation may partially restore intracellular SAM pools and rescue SIRT1 deficiency‐induced neonatal lethality. In support of this idea, maternal dietary supplementation of 1.3% methionine for 3–4 weeks before breeding significantly increased the percentage of SIRT1 KO newborns from 0 to 9.5% of all surviving P1.5–P10.5 pups (Figs 8F and EV5E, and Appendix Table S4, P < 2.2 × 10⁻¹⁶, Pearson's chi‐square goodness‐of‐fit test). On the other hand, methionine supplementation at E0.5 failed to rescue the survival of SIRT1 KO pups (Fig 8F and Appendix Table S4), indicating that SIRT1 is required for maintenance of a balanced methionine metabolism at very early stages of gestation, presumably in pre‐implantation embryos. In line with the increased survival rate, the surviving P1.5 SIRT1 KO pups under methionine supplemented diet had normal levels of H3K4me3 compared to WT and Het littermates (Fig 8G). Therefore, despite various mechanisms proposed for SIRT1's actions in mouse ESCs and embryogenesis (Han et al, 2008; Tang et al, 2014; Williams et al, 2016; Heo et al, 2017), our observations demonstrate that defective methionine metabolism is one of the major mechanisms that underlies SIRT1 deficiency‐induced compromise of pluripotency in mESCs and neonatal lethality in mice.
Discussion
As a key metabolic network that integrates nutritional signals with biosynthesis, redox homeostasis, and epigenetics, one‐carbon metabolism plays essential roles in regulation of cell proliferation, stress resistance, ESC functions, and embryo development (Locasale, 2013; Shyh‐Chang et al, 2013a; Shiraki et al, 2014; Mentch et al, 2015; Xu & Sinclair, 2015; Mentch & Locasale, 2016). However, in spite of the importance of these diverse biological functions, the transcriptional regulation of one‐carbon metabolism, particularly methionine metabolism, is almost completely unknown. In the present study, we discovered that cellular methionine metabolism is under control of SIRT1, an important cellular metabolic sensor. We showed that the SIRT1‐Myc axis is vital for conversion of methionine to SAM, thereby impacting maintenance of the methylation status of core histone proteins and profiles of gene expression. This regulation directly couples methionine metabolism with cellular energy status and is critical in epigenetic regulation of mESC functions and mouse embryogenesis (Appendix Fig S6). Our findings uncover a critical mechanistic action of SIRT1 in mESCs and provide novel insights into the regulation of methionine metabolic process for animal development.
SIRT1 is well known for its deacetylase activity toward a number of histone acetylation marks, including H3K9Ac, H4K16Ac, and H3K56Ac (Imai et al, 2000; Vaquero et al, 2004; Bosch‐Presegue & Vaquero, 2015). These modifications have been shown to be important in maintenance of genome integrity in response to environmental stress (Bosch‐Presegue & Vaquero, 2015) as well as for metabolic reprogramming‐induced activation of muscle gene transcription during the transition from quiescence to proliferation in skeletal muscle stem cells (Ryall et al, 2015). However, in our present study, we revealed that loss of SIRT1 has more profound impacts on histone methylation than acetylation in mESCs (Fig 5A). Moreover, in contradiction to previous reports that activation of SIRT1 increases a histone repressive mark H3K9me3 and promotes heterochromatin formation (Vaquero et al, 2004, 2007), increased SIRT1 activity in mESCs is associated with elevation of histone activation marks such as H3K4me3. More interestingly, the regulation of histone methylation by SIRT1 in mESCs is primarily through activation of methionine metabolism. One possible factor contributing to the apparent discrepancy between our observations and those of previous reports may be the unusually high dependence of the ESCs on methionine metabolism compared to other cell types. This unique requirement of high metabolic flux via one‐carbon metabolism makes ESCs hypersensitive to SIRT1 deletion‐induced impairments in methionine metabolism and histone methylation. In support of this idea, SIRT1 deficiency failed to induce hypersensitivity to methionine restriction‐induced cell death in mouse embryonic fibroblasts and hepatic cell lines (unpublished observations). It will be of great interest to further investigate the cell type‐specific roles of SIRT1 in metabolic regulation of epigenetics and transcription.
It is worth noting that although our study indicated that SIRT1 regulates methionine metabolism and histone methylation in part through Myc‐mediated expression of Mat2 enzymes (Fig 7), promoter analyses of Mat2 genes predicate that the expression of these genes might be also under the control of several other transcription factors involved in the regulation of ESC pluripotency, such as BRG1 and Nanog (Appendix Fig S5). Therefore, in future studies it will be interesting to test whether cellular methionine metabolism is indeed modulated by these factors and whether SIRT1 also plays a role in these regulations.
SIRT1 appears to be required for embryogenesis at different developmental stages. We observed that SIRT1 KO embryos on the pure C57BL/6J background developed normally up to E9.5 when dams were kept on the chow diet (Fig EV5B). They started to show defects in growth and eye development from E11.5, and almost all KO embryos were significantly smaller than control littermates by E14.5 (Tang et al, 2014). By E18.5, they displayed delay in bone development and defects in sarcomere alignment/organization in the heart (not shown). KO pups can be born but all of them died 1 day after birth (Fig 8F and Appendix Table S4). These observations together with the pre‐requirement of methionine at early stages of development for neonate survival (Figs 8 and EV5) suggest that the defective methionine metabolism in SIRT1 KO embryos impacts epigenetic and redox status at the pre‐implantation stage, which does not result in direct morphological abnormalities at the same stage but instead affects later development and newborn survival. It is also worth pointing out here that dietary methionine supplementation did not rescue all SIRT1 KO embryos (Fig 8F and Appendix Table S4). Morphologically all seven surviving KO pups still had growth retardation and eye developmental defects (Fig EV5) just like SIRT1 KO animals survived on the mixed genetic background (Cheng et al, 2003; McBurney et al, 2003), although their H3K4me3 levels were normal compared to WT and Het littermates (Fig 8G). These findings further support the notion that SIRT1 is required at the different developmental stages for different functions. Future studies are required to dissect the exact functions of SIRT1 at the different stages of mouse embryogenesis.
In summary, we have shown that methionine metabolism in mESCs is controlled by a key cellular metabolic sensor SIRT1. Through regulation of Myc and cellular methionine metabolism, SIRT1 is vital for maintenance of mESCs and normal animal development. Our findings establish a direct link between SIRT1, methionine metabolism, epigenetic regulation of mESCs, and embryonic development, and highlighting the importance of methionine metabolism in SIRT1‐regulated mESC maintenance and embryonic development.
Materials and Methods
Animal studies
Whole‐body SIRT1 knockout, heterozygote and their age‐matched littermate WT mice on the C57BL/6J background have been reported before (Tang et al, 2014). They were housed in individualized ventilated cages (Techniplast, Exton, PA) with a combination of autoclaved nesting material (Nestlets, Ancare Corp., Bellmore, NY, and Crink‐l'Nest, The Andersons, Inc., Maumee, OH) and housed on hardwood bedding (Sani‐chips, PJ Murphy, Montville, NJ). Mice were maintained on a 12‐h:12‐h light:dark cycle at 22 ± 0.5°C and relative humidity of 40–60%. Mice were provided ad libitum autoclaved rodent diet (NIH31, Harlan Laboratories, Madison, WI) and de‐ionized water treated by reverse osmosis. Mice were negative for mouse hepatitis virus, Sendai virus, pneumonia virus of mice, mouse parvoviruses 1 and 2, epizootic diarrhea of infant mice, mouse norovirus, Mycoplasma pulmonis, Helicobacter spp., and endo‐ and ectoparasites upon receipt and no pathogens were detected in sentinel mice during this study.
To investigate the effects of maternal methionine restriction on embryonic development of control and SIRT1 KO mice, 2‐ to 3‐month‐old SIRT1 heterozygous (Sirt1 +/−) female mice were bred with age‐matched Sirt1 +/− male mice. The following morning, females with the mating plug (E0.5) were separated from the males into a new cage and fed with a normal chow diet (NIH‐31, which contains 0.39% methionine), or a methionine‐deficient diet containing 0.172% DL‐methionine (#510029, Dyets, Inc., Bethlehem, PA). Embryos from E8.5, E12.5, and E14.5 were then collected and analyzed. To investigate the effects of maternal methionine supplementation on neonatal survival of control and SIRT1 KO mice, 2‐ to 3‐month‐old SIRT1 heterozygous (Sirt1 +/−) female mice were fed with a chow diet or a methionine supplemented chow diet containing 1.3% l‐methionine (custom made with Envigo) either 3–4 weeks before breeding (pre‐feeding) or at E0.5 after breeding with age‐matched Sirt1 +/− male mice. Pregnant dams were maintained on their respective diets during the experiment, and newborn pups from P1.5 to P10.5 were analyzed daily for their survival.
Animal numbers in each group were chosen to achieve 1.5‐fold difference with 95% of power. Animals were simply randomized during the group assignment by an animal technician, and the investigators were not blinded to the group allocation.
All animal procedures were reviewed and approved by National Institute of Environmental Health Sciences Animal Care and Use Committee. All animals were housed, cared for, and used in compliance with the Guide for the Care and Use of Laboratory Animals and housed and used in an Association for the Assessment and Accreditation of Laboratory Animal Care, International (AAALAC) Program.
Isolation, culture, and immunofluorescent staining of pre‐implantation mouse embryos
CF‐1 female mice (6–8 weeks old; Harlan Laboratories, Indianapolis, IN) were superovulated with 5 IU equine chorionic gonadotropin (Calbiochem, San Diego, CA) followed 48 h later with 5 IU human chorionic gonadotropin (hCG; Calbiochem). The females were then bred overnight with B6SJLF1/J males (8–12 weeks old; Jackson Laboratories, Bar Harbor, ME). One‐cell‐stage embryos were isolated from the oviducts at 22 h following hCG injection and either fixed and processed immediately or cultured until the 2C, 8C, or blastocyst stage in KSOM medium (EMD Millipore, Billerica, MA; cat. no. MR‐106‐D). The embryos were fixed in 4% paraformaldehyde containing 1 μM taxol (Sigma, St. Louis, MO) for 30 min, permeabilized in PBS containing 3 mg/ml BSA (PBS/BSA) and 0.1% Triton X‐100 for 15 min, and were blocked and washed in PBS/BSA containing 0.01% Tween‐20. Embryos were then incubated in rabbit anti‐SIRT1 polyclonal antibody (1:500; cat. no. 2028, Cell Signaling Technology, Danvers, MA) overnight at 4°C. Following washing, the embryos were incubated in anti‐rabbit Alexa‐Fluor 568 (1:500; Thermo Fisher Scientific, Waltham, MA) for 1 h at room temperature. The embryos were then washed and mounted in Vectashield (Vector Laboratories, Burlingame, CA), and slides were scanned using a Zeiss LSM 510 UV confocal microscope.
Cell culture
E14 mouse embryonic stem cells stably infected with sh‐Control or SIRT1 shRNA and WT and SIRT1 KO mESCs have been reported (McBurney et al, 2003; Tang et al, 2014). All stem cells were maintained on gelatin‐coated plates in the ESGRO Complete Clonal Grade Medium (Millipore) and then cultured in the M10 medium (high‐glucose DMEM, 10% ES cell FBS, 2 mM l‐glutamine, 1 mM sodium pyruvate, 0.1 mM nonessential amino acids, 10 μM 2‐mercaptoethanol, and 500 units/ml leukocyte inhibitory factor). The amino acid‐free DMEM and amino acid components were purchased from Sigma.
Alkaline phosphatase staining and alkaline phosphatase activity assays
The alkaline phosphatase staining assay was performed using the alkaline phosphatase staining kit II as per manufacturer's instructions (Stemgent, Cambridge, MA; cat. no. 00‐0055), and the alkaline phosphatase activity assay was performed with an alkaline phosphatase assay kit (Abcam, Cambridge, MA; cat. no. ab83369).
Metabolomic analysis
To quantitatively analyze metabolic profiles in WT and KO mESCs cultured in the complete medium or methionine‐restricted medium, about 100 μl of packed cell pellet per sample was submitted to Metabolon, Inc. (Durham, NC, USA), where the relative amounts of small molecular metabolites were determined using four platforms of ultra‐high‐performance liquid chromatography–tandem mass spectroscopy (UPLC‐MS/MS) as previously described (Evans et al, 2014). All methods utilized a Waters ACQUITY UPLC and a Thermo Scientific Q‐Exactive high‐resolution/accurate mass spectrometer interfaced with a heated electrospray ionization (HESI‐II) source and Orbitrap mass analyzer operated at 35,000 mass resolution. Raw data collected from above four analyses were managed by the Metabolon Laboratory Information Management System (LIMS), extracted, peak‐identified and QC‐processed using Metabolon's hardware and software. The hardware and software foundations for these informatics components were the LAN backbone, and a database server running Oracle 10.2.0.1 Enterprise Edition.
Targeted analysis of methionine‐related metabolites by liquid chromatography/mass spectrometry (LC/MS)
To quantitatively analyze metabolites in methionine‐related metabolic pathways, WT and KO mESCs cultured in the complete medium or methionine‐restricted medium were extracted with cold methanol:water (4:1, v/v) (−80°C) (Fan et al, 2014). The resulting supernatant were analyzed by LC/MS performed in multiple reaction monitoring (MRM) mode using a Shimadzu LC system (comprising a solvent degasser, two LC‐10A pumps, and a SCL‐10A system controller) coupled to a 4000 Q‐Trap hybrid triple quadrupole linear ion‐trap mass spectrometer equipped with a Turbo V ion source (AB‐Sciex, Foster City, CA). The MRM pairs (precursor ion/product ion) for monitoring the metabolites in the positive ion mode were as follows: Met, 150.0/133.0; SAM, 399.0/250.0; SAH, 385.0/136.0; homocysteine, 136.0/90.0; methylcysteine, 136.0/119.0; GSH, 308.0/162.0; MTA, 298.0/136.0; Ala, 90.0/44.0. Data acquisition and metabolite quantification were performed using the Analyst 1.4 software (AB‐Sciex, Foster City, CA), and the level of Ala was used to normalize each metabolite in WT and KO mESCs.
Histone extraction and methylation analysis
Histone extraction from WT and SIRT1 KO mESCs was performed according to the protocol from Abcam. Histone extracts were then immunoblotted with antibodies against H3K4me3 (Active Motif; cat. no. 39159), H3K4me2 (Millipore; cat. no. 07‐030), H3K4me1 (Abcam; cat. no. ab8895), H3K27me3 (Active Motif; cat. no. 39155), H3K36me3 (Abcam; cat. no. ab9050), H3K9ac (Abcam; cat. no. ab4441), and histone H3 (Abcam; cat. no. ab1791).
Protein acetylation
To investigate the acetylation levels of N‐Myc and c‐Myc in mESCs, WT and SIRT1 KO mESCs, or WT and SIRT1 KO mESCs infected with lentiviruses expressing GFP‐tagged N‐Myc or HA‐tagged c‐Myc proteins, were treated with 2 μM TSA and 25 μM MG132 for 2 h and lysed in the NP40 buffer described before (Tang et al, 2014). Myc proteins were then immunoprecipitated from the whole‐cell extracts with antibodies against N‐Myc (Santa Cruz Biotechnology; cat. no. sc‐791) or c‐Myc (Cell Signaling; cat. no. 5605S) and analyzed by anti‐acetyl‐lysine polyclonal antibodies (Immunechem; cat. no. ICP0380).
Chromatin immunoprecipitation
Chromatin immunoprecipitation (ChIP) analysis was performed as previously described by Shimbo et al (2013) with some modifications. The anti‐N‐Myc and c‐Myc antibodies were from Santa Cruz Biotechnology.
Immunoblotting
The protein levels were analyzed by immunoblotting using the following antibodies: rabbit antibody to Nanog (Millipore; cat. no. ab5731), goat antibody to Oct4 (Santa Cruz Biotechnology; cat. no. sc8628), rabbit antibody to N‐Myc (Abcam; cat. no. ab24193), rabbit antibody to MAT2A (Abcam; cat. no. ab77471), and mouse antibody to SIRT1 (Sigma; cat. no. S5196).
Flow cytometry staining
To quantify the pluripotency of WT and SIRT1 KO mESCs, mESCs cultured in complete M10 medium were harvested with trypsin and then fixed and prepared for flow cytometry staining with the BD Cytofix/Cytoperm™ Fixation/Permeabilization Solution Kit using an anti‐Nanog antibody (R&D; cat. no. AF2729).
Luciferase assay
For transactivation experiments, cells were transfected with firefly luciferase reporters driven by the mouse Mat2a promoters containing different Myc binding sites together with control pRL‐TK (Renilla Luciferase, Promega), and constructs expressing N‐Myc and/or c‐Myc proteins. Cells were cultured for 24 h, and the luciferase activity was measured using the Dual‐Luciferase Reporter Assay System (Promega). The final firefly luciferase activity was normalized to the co‐expressed renilla luciferase activity.
Quantitative real‐time PCR
RNAs from mESCs or tissues were isolated using the Qiagen RNeasy mini‐kit. cDNA was synthesized with the ABI reverse transcriptase kit and analyzed using SYBR Green Supermix (Applied Biosystems) for quantitative real‐time PCR (Tang et al, 2014). Three biological repeats were carried out for each experiment, and all of the data were normalized to 18S or actin RNA.
Microarray analysis
Total RNAs from WT and SIRT1 KO mESCs under normal medium, methionine restriction medium for 6, 24 and 72 h were isolated using the Qiagen RNeasy mini‐kit. Gene expression analysis was conducted using Agilent Whole Mouse Genome 4×44 multiplex format oligo arrays (014868) (Agilent Technologies) following the Agilent 1‐color microarray‐based gene expression analysis protocol. Starting with 500 ng of total RNA, Cy3‐labeled cRNA was produced according to the manufacturer's protocol. For each sample, 1.65 μg of Cy3‐labeled cRNAs were fragmented and hybridized for 17 h in a rotating hybridization oven. Slides were washed and then scanned with an Agilent Scanner. Data were obtained using the Agilent Feature Extraction software (v9.5), using the 1‐color defaults for all parameters. The Agilent Feature Extraction Software performed error modeling, adjusting for additive and multiplicative noise. Differential gene expression was examined using the Partek Genomics Suite (Partek, Inc., St. Louis, MO, USA), To identify differentially expressed probes, analysis of variance (ANOVA), Benjamini–Hochberg multiple test correction was used (FDR < 0.05). Partek Genomics Suite was further used to generate heat maps for visual analyses and to support generation of hierarchical clustering dendrograms. Lists of significant probes were further analyzed using Ingenuity Pathway Analysis (IPA, Content version 26127183) (Ingenuity Systems, Redwood City, CA). Enrichment and overlap were determined by IPA using Fisher's exact test (P < 0.05).
Accession number
The Gene Expression Omnibus accession number for the data reported in this paper is GSE77757.
Statistical analysis
Values are expressed as mean ± standard error of mean (SEM) from at least three independent experiments or biological replicate, unless otherwise indicated in the figure legend. Significant differences between the means were analyzed by the two‐tailed, unpaired, non‐parametric Mann–Whitney test, and differences were considered significant at P < 0.05. P‐values (P < 0.05) for gene list overlap were determined using Fisher's exact test. P‐values (P < 0.05) for the survival rates of SIRT1 KO embryos under different maternal diet feeding compared with the expected Mendelian ratio were determined using Pearson's chi‐square goodness‐of‐fit test.
Author contributions
ST designed and carried out experiments, analyzed data, and wrote the manuscript. YF designed and carried out experiments and analyzed data. GH supported the study. XX and DCF analyzed the microarray data and mouse Mat2 promoters. EPB and CJW analyzed the expression of SIRT1 in mouse pre‐implantation embryos. WF and QX carried out experiments. JFF and SD bred animals and analyzed embryonic development. MWM provided WT and SIRT1 KO mESCs and critically reviewed the manuscript. SMS and JWL analyzed metabolites by metabolomics and critically reviewed the manuscript. ZG analyzed metabolites by LC/MS and critically reviewed the manuscript. XL designed the study, carried out experiments, analyzed data, and wrote the manuscript.
Conflict of interest
The authors declare that they have no conflict of interest.
Supporting information
Appendix
Expanded View Figures PDF
Source Data for Appendix
Review Process File
Source Data for Figure 1
Source Data for Figure 3
Source Data for Figure 5
Source Data for Figure 6
Source Data for Figure 7
Source Data for Figure 8
Acknowledgements
We thank Drs. Paul Wade, Guang Hu, and members of the Li laboratory for critical reading of the manuscript. We would also like to thank Dr. Schantel Bouknight from Charles River Laboratories for histological analyses of mouse embryos. This research was supported by the Intramural Research Program of National Institute of Environmental Health Sciences of the NIH to X.L. (Z01 ES102205). Z. G. and the MS facility in the Department of Biochemistry of Duke University Medical Center were supported by the Lipid Maps Collaborative Grant (the Lipid Maps Collaborative Grant) and EY023666 from the NIH. This research was also supported, in part, by a research grant to G. H. (The National Natural Science Foundation of China, Grant No. 81530053).
The EMBO Journal (2017) 36: 3175–3193
References
- Barker DJ (2004) The developmental origins of well‐being. Philos Trans R Soc Lond B Biol Sci 359: 1359–1366 [DOI] [PMC free article] [PubMed] [Google Scholar]
- Bosch‐Presegue L, Vaquero A (2015) Sirtuin‐dependent epigenetic regulation in the maintenance of genome integrity. FEBS J 282: 1745–1767 [DOI] [PubMed] [Google Scholar]
- Cai L, Sutter BM, Li B, Tu BP (2011) Acetyl‐CoA induces cell growth and proliferation by promoting the acetylation of histones at growth genes. Mol Cell 42: 426–437 [DOI] [PMC free article] [PubMed] [Google Scholar]
- Carey BW, Finley LW, Cross JR, Allis CD, Thompson CB (2015) Intracellular alpha‐ketoglutarate maintains the pluripotency of embryonic stem cells. Nature 518: 413–416 [DOI] [PMC free article] [PubMed] [Google Scholar]
- Chen X, Xu H, Yuan P, Fang F, Huss M, Vega VB, Wong E, Orlov YL, Zhang W, Jiang J, Loh YH, Yeo HC, Yeo ZX, Narang V, Govindarajan KR, Leong B, Shahab A, Ruan Y, Bourque G, Sung WK et al (2008) Integration of external signaling pathways with the core transcriptional network in embryonic stem cells. Cell 133: 1106–1117 [DOI] [PubMed] [Google Scholar]
- Cheng HL, Mostoslavsky R, Saito S, Manis JP, Gu Y, Patel P, Bronson R, Appella E, Alt FW, Chua KF (2003) Developmental defects and p53 hyperacetylation in Sir2 homolog (SIRT1)‐deficient mice. Proc Natl Acad Sci USA 100: 10794–10799 [DOI] [PMC free article] [PubMed] [Google Scholar]
- Dang CV, Le A, Gao P (2009) MYC‐induced cancer cell energy metabolism and therapeutic opportunities. Clin Cancer Res 15: 6479–6483 [DOI] [PMC free article] [PubMed] [Google Scholar]
- Dang CV (2012) Links between metabolism and cancer. Genes Dev 26: 877–890 [DOI] [PMC free article] [PubMed] [Google Scholar]
- Evans AM, Bridgewater BR, Miller LAD, Mitchell MW, Robinson RJ, Dai H, Stewart SJ, DeHaven CD, Liu Q (2014) High resolution mass spectrometry improves data quantity and quality as compared to unit mass resolution mass spectrometry in high‐throughput profiling metabolomics. Metabolomics 4: 132 [Google Scholar]
- Fan J, Ye J, Kamphorst JJ, Shlomi T, Thompson CB, Rabinowitz JD (2014) Quantitative flux analysis reveals folate‐dependent NADPH production. Nature 510: 298–302 [DOI] [PMC free article] [PubMed] [Google Scholar]
- Folmes CD, Dzeja PP, Nelson TJ, Terzic A (2012) Metabolic plasticity in stem cell homeostasis and differentiation. Cell Stem Cell 11: 596–606 [DOI] [PMC free article] [PubMed] [Google Scholar]
- Goll MG, Bestor TH (2005) Eukaryotic cytosine methyltransferases. Annu Rev Biochem 74: 481–514 [DOI] [PubMed] [Google Scholar]
- Guarente L (2013) Calorie restriction and sirtuins revisited. Genes Dev 27: 2072–2085 [DOI] [PMC free article] [PubMed] [Google Scholar]
- Halim AB, LeGros L, Geller A, Kotb M (1999) Expression and functional interaction of the catalytic and regulatory subunits of human methionine adenosyltransferase in mammalian cells. J Biol Chem 274: 29720–29725 [DOI] [PubMed] [Google Scholar]
- Han MK, Song EK, Guo Y, Ou X, Mantel C, Broxmeyer HE (2008) SIRT1 regulates apoptosis and Nanog expression in mouse embryonic stem cells by controlling p53 subcellular localization. Cell Stem Cell 2: 241–251 [DOI] [PMC free article] [PubMed] [Google Scholar]
- Heo J, Lim J, Lee S, Jeong J, Kang H, Kim Y, Kang JW, Yu HY, Jeong EM, Kim K, Kucia M, Waigel SJ, Zacharias W, Chen Y, Kim IG, Ratajczak MZ, Shin DM (2017) Sirt1 regulates DNA methylation and differentiation potential of embryonic stem cells by antagonizing Dnmt3l. Cell Rep 18: 1930–1945 [DOI] [PubMed] [Google Scholar]
- Imai S, Armstrong CM, Kaeberlein M, Guarente L (2000) Transcriptional silencing and longevity protein Sir2 is an NAD‐dependent histone deacetylase. Nature 403: 795–800 [DOI] [PubMed] [Google Scholar]
- Imai S, Guarente L (2014) NAD+ and sirtuins in aging and disease. Trends Cell Biol 24: 464–471 [DOI] [PMC free article] [PubMed] [Google Scholar]
- Ito K, Suda T (2014) Metabolic requirements for the maintenance of self‐renewing stem cells. Nat Rev Mol Cell Biol 15: 243–256 [DOI] [PMC free article] [PubMed] [Google Scholar]
- Kalhan SC, Marczewski SE (2012) Methionine, homocysteine, one carbon metabolism and fetal growth. Rev Endocr Metab Disord 13: 109–119 [DOI] [PubMed] [Google Scholar]
- Kang MR, Lee SW, Um E, Kang HT, Hwang ES, Kim EJ, Um SJ (2009) Reciprocal roles of SIRT1 and SKIP in the regulation of RAR activity: implication in the retinoic acid‐induced neuronal differentiation of P19 cells. Nucleic Acids Res 38: 822–831 [DOI] [PMC free article] [PubMed] [Google Scholar]
- Kidder BL, Yang J, Palmer S (2008) Stat3 and c‐Myc genome‐wide promoter occupancy in embryonic stem cells. PLoS ONE 3: e3932 [DOI] [PMC free article] [PubMed] [Google Scholar]
- Kim J, Chu J, Shen X, Wang J, Orkin SH (2008) An extended transcriptional network for pluripotency of embryonic stem cells. Cell 132: 1049–1061 [DOI] [PMC free article] [PubMed] [Google Scholar]
- Locasale JW (2013) Serine, glycine and one‐carbon units: cancer metabolism in full circle. Nat Rev Cancer 13: 572–583 [DOI] [PMC free article] [PubMed] [Google Scholar]
- Marshall GM, Liu PY, Gherardi S, Scarlett CJ, Bedalov A, Xu N, Iraci N, Valli E, Ling D, Thomas W, van Bekkum M, Sekyere E, Jankowski K, Trahair T, Mackenzie KL, Haber M, Norris MD, Biankin AV, Perini G, Liu T (2011) SIRT1 promotes N‐Myc oncogenesis through a positive feedback loop involving the effects of MKP3 and ERK on N‐Myc protein stability. PLoS Genet 7: e1002135 [DOI] [PMC free article] [PubMed] [Google Scholar]
- McBurney MW, Yang X, Jardine K, Hixon M, Boekelheide K, Webb JR, Lansdorp PM, Lemieux M (2003) The mammalian SIR2alpha protein has a role in embryogenesis and gametogenesis. Mol Cell Biol 23: 38–54 [DOI] [PMC free article] [PubMed] [Google Scholar]
- McMillan JM, Walle UK, Walle T (2005) S‐adenosyl‐L‐methionine: transcellular transport and uptake by Caco‐2 cells and hepatocytes. J Pharm Pharmacol 57: 599–605 [DOI] [PubMed] [Google Scholar]
- Menssen A, Hydbring P, Kapelle K, Vervoorts J, Diebold J, Luscher B, Larsson LG, Hermeking H (2012) The c‐MYC oncoprotein, the NAMPT enzyme, the SIRT1‐inhibitor DBC1, and the SIRT1 deacetylase form a positive feedback loop. Proc Natl Acad Sci USA 109: E187–E196 [DOI] [PMC free article] [PubMed] [Google Scholar]
- Mentch SJ, Locasale JW (2016) One‐carbon metabolism and epigenetics: understanding the specificity. Ann N Y Acad Sci 1363: 91–98 [DOI] [PMC free article] [PubMed] [Google Scholar]
- Mentch SJ, Mehrmohamadi M, Huang L, Liu X, Gupta D, Mattocks D, Gomez Padilla P, Ables G, Bamman MM, Thalacker‐Mercer AE, Nichenametla SN, Locasale JW (2015) Histone methylation dynamics and gene regulation occur through the sensing of one‐carbon metabolism. Cell Metab 22: 861–873 [DOI] [PMC free article] [PubMed] [Google Scholar]
- Peng S, Chen LL, Lei XX, Yang L, Lin H, Carmichael GG, Huang Y (2011) Genome‐wide studies reveal that Lin28 enhances the translation of genes important for growth and survival of human embryonic stem cells. Stem Cells 29: 496–504 [DOI] [PubMed] [Google Scholar]
- Prozorovski T, Schulze‐Topphoff U, Glumm R, Baumgart J, Schroter F, Ninnemann O, Siegert E, Bendix I, Brustle O, Nitsch R, Zipp F, Aktas O (2008) Sirt1 contributes critically to the redox‐dependent fate of neural progenitors. Nat Cell Biol 10: 385–394 [DOI] [PubMed] [Google Scholar]
- Rees WD, Wilson FA, Maloney CA (2006) Sulfur amino acid metabolism in pregnancy: the impact of methionine in the maternal diet. J Nutr 136: 1701S–1705S [DOI] [PubMed] [Google Scholar]
- Ryall JG, Dell'Orso S, Derfoul A, Juan A, Zare H, Feng X, Clermont D, Koulnis M, Gutierrez‐Cruz G, Fulco M, Sartorelli V (2015) The NAD(+)‐dependent SIRT1 deacetylase translates a metabolic switch into regulatory epigenetics in skeletal muscle stem cells. Cell Stem Cell 16: 171–183 [DOI] [PMC free article] [PubMed] [Google Scholar]
- Schug TT, Li X (2011) Sirtuin 1 in lipid metabolism and obesity. Ann Med 43: 198–211 [DOI] [PMC free article] [PubMed] [Google Scholar]
- Shi Y (2007) Histone lysine demethylases: emerging roles in development, physiology and disease. Nat Rev Genet 8: 829–833 [DOI] [PubMed] [Google Scholar]
- Shimbo T, Du Y, Grimm SA, Dhasarathy A, Mav D, Shah RR, Shi H, Wade PA (2013) MBD3 localizes at promoters, gene bodies and enhancers of active genes. PLoS Genet 9: e1004028 [DOI] [PMC free article] [PubMed] [Google Scholar]
- Shiraki N, Shiraki Y, Tsuyama T, Obata F, Miura M, Nagae G, Aburatani H, Kume K, Endo F, Kume S (2014) Methionine metabolism regulates maintenance and differentiation of human pluripotent stem cells. Cell Metab 19: 780–794 [DOI] [PubMed] [Google Scholar]
- Shyh‐Chang N, Locasale JW, Lyssiotis CA, Zheng Y, Teo RY, Ratanasirintrawoot S, Zhang J, Onder T, Unternaehrer JJ, Zhu H, Asara JM, Daley GQ, Cantley LC (2013a) Influence of threonine metabolism on S‐adenosylmethionine and histone methylation. Science 339: 222–226 [DOI] [PMC free article] [PubMed] [Google Scholar]
- Shyh‐Chang N, Zhu H, Yvanka de Soysa T, Shinoda G, Seligson MT, Tsanov KM, Nguyen L, Asara JM, Cantley LC, Daley GQ (2013b) Lin28 enhances tissue repair by reprogramming cellular metabolism. Cell 155: 778–792 [DOI] [PMC free article] [PubMed] [Google Scholar]
- Takubo K, Nagamatsu G, Kobayashi CI, Nakamura‐Ishizu A, Kobayashi H, Ikeda E, Goda N, Rahimi Y, Johnson RS, Soga T, Hirao A, Suematsu M, Suda T (2013) Regulation of glycolysis by Pdk functions as a metabolic checkpoint for cell cycle quiescence in hematopoietic stem cells. Cell Stem Cell 12: 49–61 [DOI] [PMC free article] [PubMed] [Google Scholar]
- Tang S, Huang G, Fan W, Chen Y, Ward JM, Xu X, Xu Q, Kang A, McBurney MW, Fargo DC, Hu G, Baumgart‐Vogt E, Zhao Y, Li X (2014) SIRT1‐mediated deacetylation of CRABPII regulates cellular retinoic acid signaling and modulates embryonic stem cell differentiation. Mol Cell 55: 843–855 [DOI] [PMC free article] [PubMed] [Google Scholar]
- Vaquero A, Scher M, Lee D, Erdjument‐Bromage H, Tempst P, Reinberg D (2004) Human SirT1 interacts with histone H1 and promotes formation of facultative heterochromatin. Mol Cell 16: 93–105 [DOI] [PubMed] [Google Scholar]
- Vaquero A, Scher M, Erdjument‐Bromage H, Tempst P, Serrano L, Reinberg D (2007) SIRT1 regulates the histone methyl‐transferase SUV39H1 during heterochromatin formation. Nature 450: 440–444 [DOI] [PubMed] [Google Scholar]
- Wang RH, Sengupta K, Li C, Kim HS, Cao L, Xiao C, Kim S, Xu X, Zheng Y, Chilton B, Jia R, Zheng ZM, Appella E, Wang XW, Ried T, Deng CX (2008) Impaired DNA damage response, genome instability, and tumorigenesis in SIRT1 mutant mice. Cancer Cell 14: 312–323 [DOI] [PMC free article] [PubMed] [Google Scholar]
- Wang J, Alexander P, Wu L, Hammer R, Cleaver O, McKnight SL (2009) Dependence of mouse embryonic stem cells on threonine catabolism. Science 325: 435–439 [DOI] [PMC free article] [PubMed] [Google Scholar]
- Ward PS, Thompson CB (2012) Metabolic reprogramming: a cancer hallmark even warburg did not anticipate. Cancer Cell 21: 297–308 [DOI] [PMC free article] [PubMed] [Google Scholar]
- Wellen KE, Hatzivassiliou G, Sachdeva UM, Bui TV, Cross JR, Thompson CB (2009) ATP‐citrate lyase links cellular metabolism to histone acetylation. Science 324: 1076–1080 [DOI] [PMC free article] [PubMed] [Google Scholar]
- Williams EO, Taylor AK, Bell EL, Lim R, Kim DM, Guarente L (2016) Sirtuin 1 promotes deacetylation of Oct4 and maintenance of naive pluripotency. Cell Rep 17: 809–820 [DOI] [PMC free article] [PubMed] [Google Scholar]
- Xu W, Yang H, Liu Y, Yang Y, Wang P, Kim SH, Ito S, Yang C, Wang P, Xiao MT, Liu LX, Jiang WQ, Liu J, Zhang JY, Wang B, Frye S, Zhang Y, Xu YH, Lei QY, Guan KL et al (2011) Oncometabolite 2‐hydroxyglutarate is a competitive inhibitor of alpha‐ketoglutarate‐dependent dioxygenases. Cancer Cell 19: 17–30 [DOI] [PMC free article] [PubMed] [Google Scholar]
- Xu J, Sinclair KD (2015) One‐carbon metabolism and epigenetic regulation of embryo development. Reprod Fertil Dev 27: 667–676 [DOI] [PubMed] [Google Scholar]
Associated Data
This section collects any data citations, data availability statements, or supplementary materials included in this article.
Supplementary Materials
Appendix
Expanded View Figures PDF
Source Data for Appendix
Review Process File
Source Data for Figure 1
Source Data for Figure 3
Source Data for Figure 5
Source Data for Figure 6
Source Data for Figure 7
Source Data for Figure 8


