
Figure 2. SIRT1 KO mESCs have altered methionine metabolism when cultured in the M10 maintenance medium.
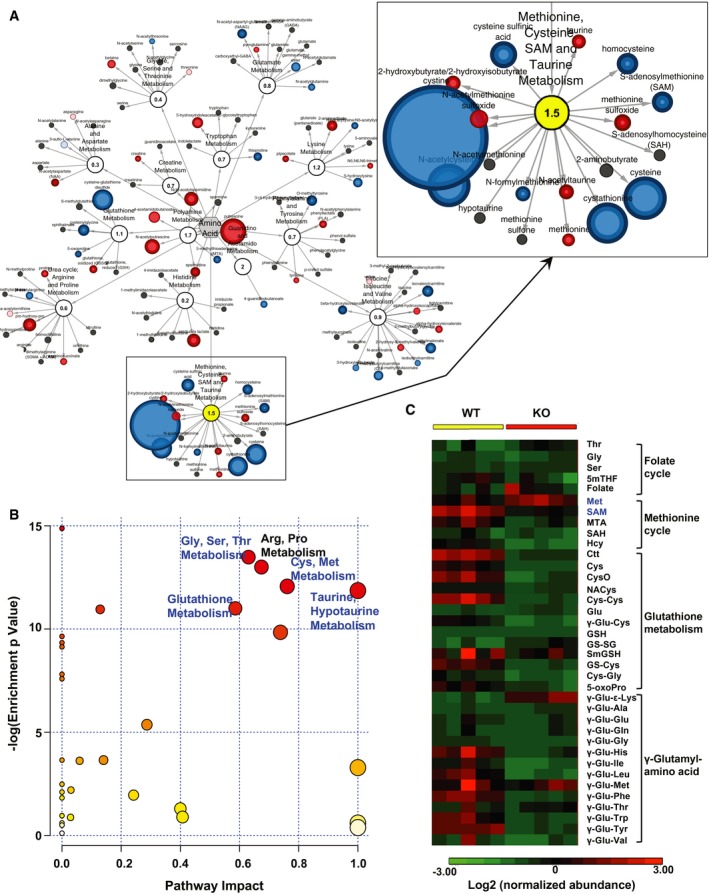
- Alterations in amino acid metabolism in SIRT1 KO versus WT mESCs. WT and SIRT1 KO mESCs were cultured in the M10 medium and analyzed by metabolomics as described in Materials and Methods. The networks of significantly changed metabolites in amino acid metabolism were analyzed by Cytoscape 2.8.3. Metabolites increased in SIRT1 KO mESCs were labeled red (P < 0.05) or pink (0.05 < P < 0.10), and metabolites decreased in SIRT1 KO mESCs were labeled blue (P < 0.05) or light blue (0.05 < P < 0.10). Metabolite node size is proportional to the fold change in KO versus WT (n = 5 independent experiments).
- Significant enrichment of pathways of one‐carbon metabolism in SIRT1 KO versus WT mESCs. WT and SIRT1 KO mESCs were cultured and analyzed by Metabolon as in (A). The metabolites in amino acid metabolism pathways were subjected to the pathway enrichment analysis and the pathway topology analysis in the pathway analysis module of MetaboAnalyst 3.0 (n = 5 independent experiments). Blue, pathways involved in one‐carbon metabolism.
- SIRT1 KO mESCs have altered one‐carbon metabolism and glutathione homeostasis. WT and SIRT1 KO mESCs cultured in M10 medium and the relative abundance of metabolites involved in one‐carbon metabolism was displayed by the heat map (n = 5 independent experiments).