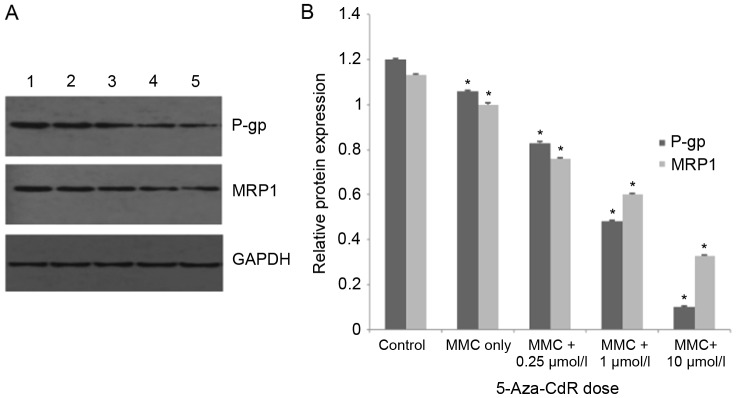
Figure 3.
Western blot analysis of P-gp and MRP1 protein in T24 cells. (A) P-gp and MRP1 in T24 cells was measured by western blotting. 1 is the control, 2 MMC only, 3 MMC + 0.25 µmol/l, 4 MMC + 1 µmol/l and 5 MMC + 10 µmol/l 5-Aza-2′ deoxycitidine. GAPDH was used as an internal control. (B) The relative protein levels, normalized to GAPDH. P-gp and MRP1 expression were decreased with increasing 5-Aza-CdR treatment. The data are presented as the mean ± standard deviation (n=3). *P<0.05 vs. control. P-gp, P-glycoprotein; MRP1, multidrug resistance-associated protein 1; MMC, mitomycin-C; 5-Aza-CdR, 5-Aza-2′-deoxycitidine.

