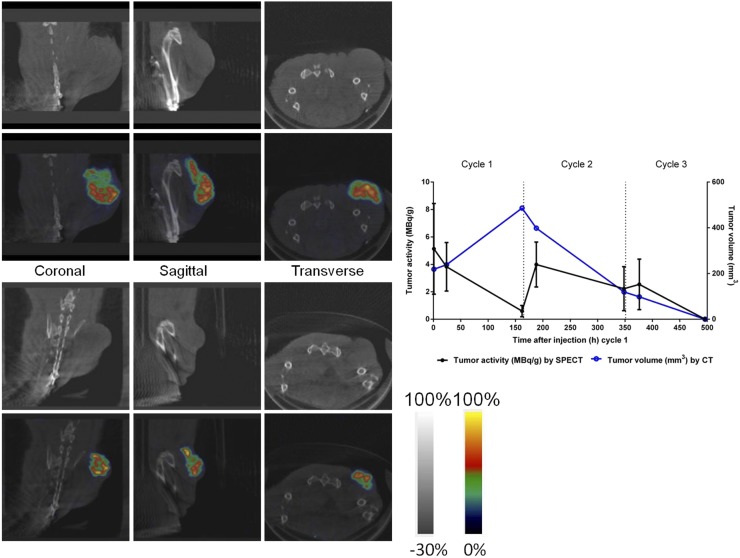
FIGURE 5.
(Left) Representative SPECT/CT images obtained from same mouse (M1) at 24 h after injection of cycle 1 (top left; CT images) and 24 h after injection of cycle 3 (bottom left; SPECT/CT fusion images). (Right) A graph depicting the effective tumor activity (as MBq/g) derived from SPECT image analysis (right axis) and tumor volume (as mm3) derived from CT image analysis (left axis) for this particular animal is provided for reference.

