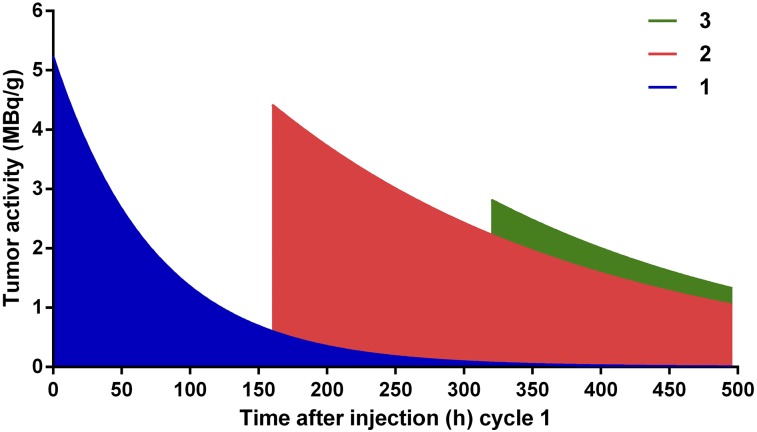
FIGURE 6.
Representation of fitted exponential decay curves on 3-cycle treatment regimen. Curves were calculated out to complete removal of radioactive label and truncated at 496 h after injection of cycle 1, when tumors were no longer grossly palpable. Cumulated dose for cycle 1 represents dose of blue region, and cumulated dose for cycle 2 includes both blue and red regions. Of total dose of ∼100 Gy, first dose contributes 30%, second dose 60%, and third dose 10% (Table 2).

