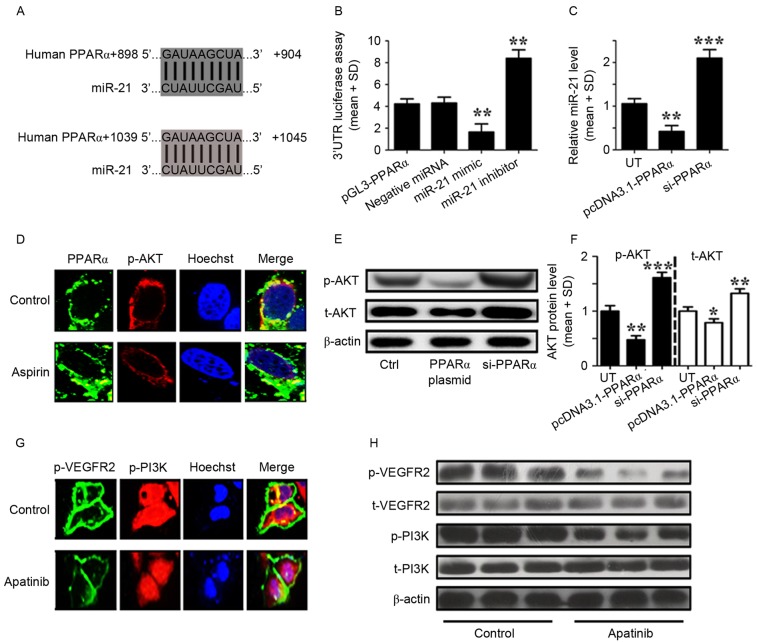
Figure 3.
Aspirin and apatinib induced PPARα expression and attenuated PI3K/AKT signaling in GC cells, respectively. (A) The PPARα 3′UTR contains binding sites for miR-21. (B) The luciferase activity of MKN45 cells was measured following co-transfection with the indicated PPARα 3′UTR reporter constructs and a miR-21 mimic, miR-21 inhibitor or negative control for 12 h. **P<0.01, miR-21 mimic group vs. negative miRNA group; miR-21 inhibitor group vs. negative miRNA group. (C) RT-qPCR was performed to detect the expression of miR-21 in MKN45 cells transfected with PPARα plasmid or siPPARα for 24 h. **P<0.01, pcDNA3.1-PPARα transfected group vs. UT group; ***P<0.001, siPPARα transfected group vs. UT group. (D) Immunofluorescence demonstrates the effects of aspirin on PPARα (green) and p-AKT (red) expression in MKN45 cells. (E) Western blotting was used to analyze the levels of p-AKT in MKN45 cells transfected with a PPARα plasmid or siPPARα. (F) The levels of p-AKT relative to the internal control (β-actin), according to western blotting results. *P<0.05, pcDNA3.1-PPARα transfected group vs. UT. (G) Immunofluorescence images showingthe effects of apatinib on p-VEGFR2 (green) and p-PI3K (red) expression in MKN45 cells. (H) Western blotting was used to analyze the levels of phosphorylated and total VEGFR2 and PI3K in MKN45 cells treated with apatinib. Control cells were treated with DMSO. The results depicted are from three representative independent experiments. VEGF, vascular endothelial growth factor; PPARα, peroxisome proliferator-activated receptor-α; miR-21, microRNA-21; PI3K, phosphoinositide-3 kinase; AKT, protein kinase B; 3′UTR, 3′ untranslated region; GC, gastric cancer; RT-qPCR, reverse transcription-quantitative polymerase chain reaction analysis; SD, standard deviation; si, small interfering; t, total; p, phosphorylated; UT, untreated cells.

