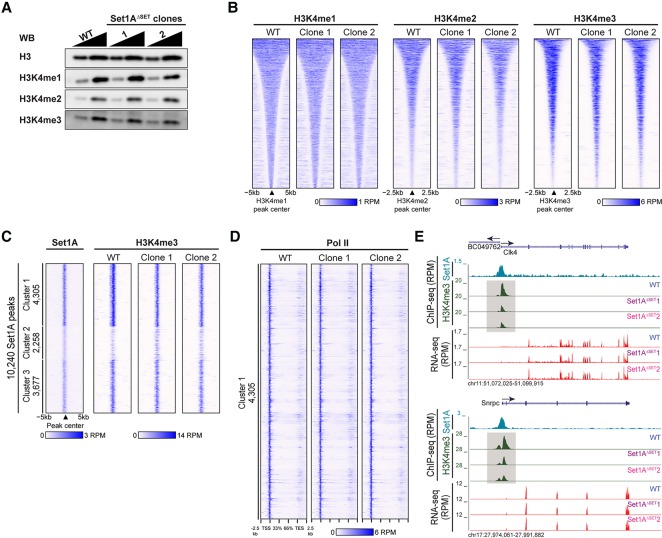
Figure 2.
Set1AΔSET in undifferentiated ESCs resulted in a decrease of H3K4me3 at specific sites. (A) Western blot comparing H3K4 methylation levels in Set1AΔSET with parental wild-type cells. H3 served as the loading control. Samples were loaded at a 1:2 ratio. (B) Heat maps of H3K4me1, H3K4me2, and H3K4me3 ChIP-seq occupancy levels in wild-type and Set1AΔSET cells. Occupancy levels were aligned to wild-type peaks sorted by decreasing peak width for each individual modification. (C) Set1A peaks (10,240) were called and partitioned into three groups by K-means clustering, and the corresponding H3K4me3 occupancy at the Set1A peaks was plotted for wild-type and mutant ESCs. (D) Pol II occupancy at the cluster 1 sites for wild-type and Set1AΔSET ESCs. (E) Genome browser track examples with corresponding RNA-seq. H3K4me3 and Set1A ChIP-seq tracks are shown. Decreases in H3K4me3 as a result of Set1AΔSET are highlighted in gray boxes.

