Figure 3.
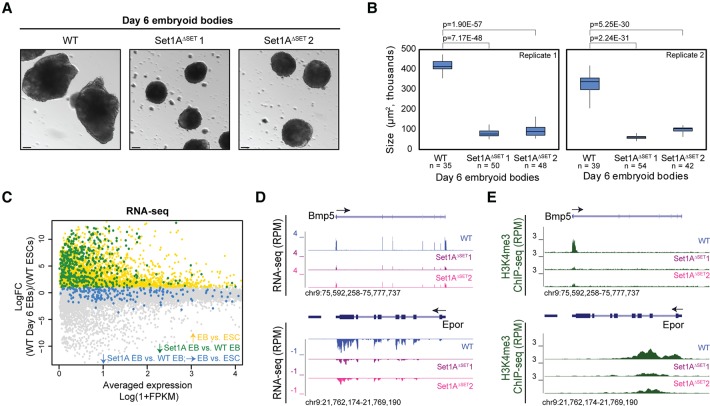
Set1AΔSET mutants exhibit defective EB differentiation. (A) Wild-type and Set1AΔSET ESCs were induced to form EBs. Emboss contrast images were taken at day 6 of EB formation. Bar, 100 µm. (B) Box plot contrasting the size (in square micrometers) of wild-type day 6 EBs to that of Set1AΔSET EBs. The number of EBs measured per sample per replicate is indicated. P-values were calculated using the Student's t-test. (C) MA plot of gene expression changes between undifferentiated wild-type ESCs and wild-type day 6 EBs. (Yellow) Up-regulated genes during differentiation; (blue) genes down-regulated in Set1AΔSET EBs not pertinent to differentiation; (green) genes down-regulated in Set1AΔSET EBs but activated during normal differentiation. Colors correspond to the categories illustrated in Supplemental Figure S3B. (D) Two genome browser track examples of genes Bmp5 and Epor down-regulated in Set1AΔSET EBs compared with wild-type EBs. (E) Example genome tracks of decreased H3K4me3 occupancy in Set1AΔSET EBs compared with wild-type EBs for the two genes shown in D.

