Figure 4.
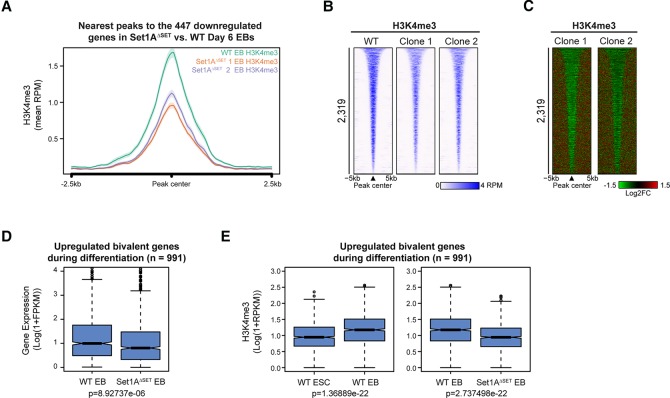
Set1A catalytic activity is required for H3K4me3 implementation during differentiation. (A) Metaplot of H3K4me3 levels for the 447 genes significantly down-regulated (as described in Fig. 3C and Supplemental Fig. S3B) in Set1AΔSET day 6 EBs relative to wild-type EBs. Peaks were centered at EB H3K4me3 peaks. (B) Heat map of H3K4me3 occupancy in wild-type and Set1AΔSET day 6 EBs. Peaks were centered at increased H3K4me3 peaks during differentiation (refer to Supplemental Fig. S4B). Peaks are rank-ordered by H3K4me3 peak width. (C) Log2 fold changes in H3K4me3 binding for peaks ordered in B. (D) Box plot gene expression analysis of the 991 bivalent genes activated during differentiation in mutant EBs versus wild-type EBs. The list of bivalent genes was from Galonska et al. (2015). P-value was determined by the Welch two-sample t-test. (E) Box plot representation of the levels of H3K4me3 peaks nearest to the 991 bivalent genes in wild-type ESCs versus wild-type EBs (left) and in wild-type EBs versus Set1AΔSET EBs (right). P-values were determined by the Welch two-sample t-test. (RPKM) Reads per kilobase of transcript per million mapped reads.

