Figure 1.
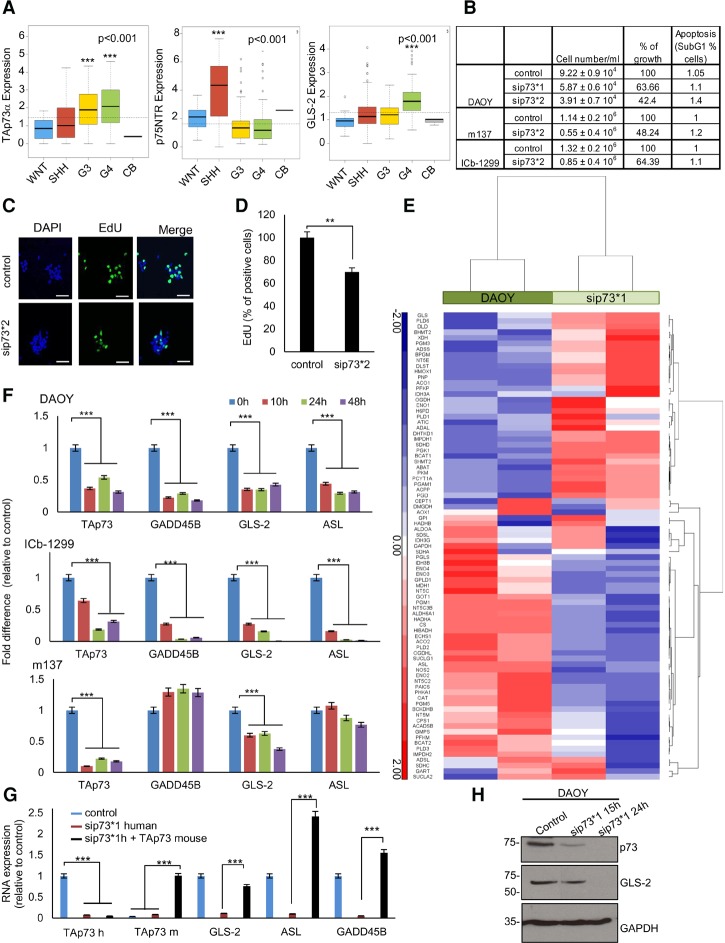
p73 is overexpressed in MB and regulates GLS-2 expression. (A) Box plot representation of TAp73α, p75NTR, and GLS-2 expression levels (FPKM [fragments per kilobase of transcript per million mapped reads]) across a cohort of 240 primary MBs. Patient numbers per group were 28 WNT, 58 SHH, 59 G3, 95 G4, and three CB. (***) P < 0.001. (B) DAOY, m137, and ICb-1299 cells were transiently transfected with scramble or sip73 (sip73*1 ID 2671; sip73*2 ID 115666). After 48 h, cells under different treatments were counted in triplicate. For apoptosis assessment (percentage of cells in SubG1), cells were stained with propidium iodide (PI) and analyzed by FACS. (C) Confocal microscope images of ICb-1299 scramble cells or sip73*2 after 48 h. We assessed cell proliferation by EdU incorporation. Bar, 20 µm. (D) Quantification of EdU staining in ICb-1299 scramble cells and sip73*2. Columns indicate mean ± SEM. n = 3. (**) P < 0.001. (E) Heat map representation of the most significantly up-regulated or down-regulated genes after sip73*1. Genes involved in metabolism were plotted. Genes were identified using Molecular Signatures Database (MSigDB) and plotted to highlight differences in expression of three z-scores or greater between the two groups. (Red) Relative up-regulation; (blue) relative down-regulation. (F) MB cells (DAOY, ICb-1299, and m137) were transiently transfected with scramble or sip73*1 for 10, 24, and 48 h. Columns indicate mean ± SEM. n = 3. (***) P < 0.0001. (G) DAOY cells were transiently transfected with scramble or sip73*1 human or sip73*1 human plus TAp73 mouse for 10 h. RT–PCR was performed for TAp73 human, TAp73 mouse, GLS-2, ASL, and GADD45B genes. Columns indicate mean ± SEM. n = 3. (***) P < 0.0001. (H) DAOY cells were transfected with scramble or sip73*1. Western blot showing p73 and GLS-2 protein levels after silencing. GAPDH was used as a loading control.

