Figure 3.
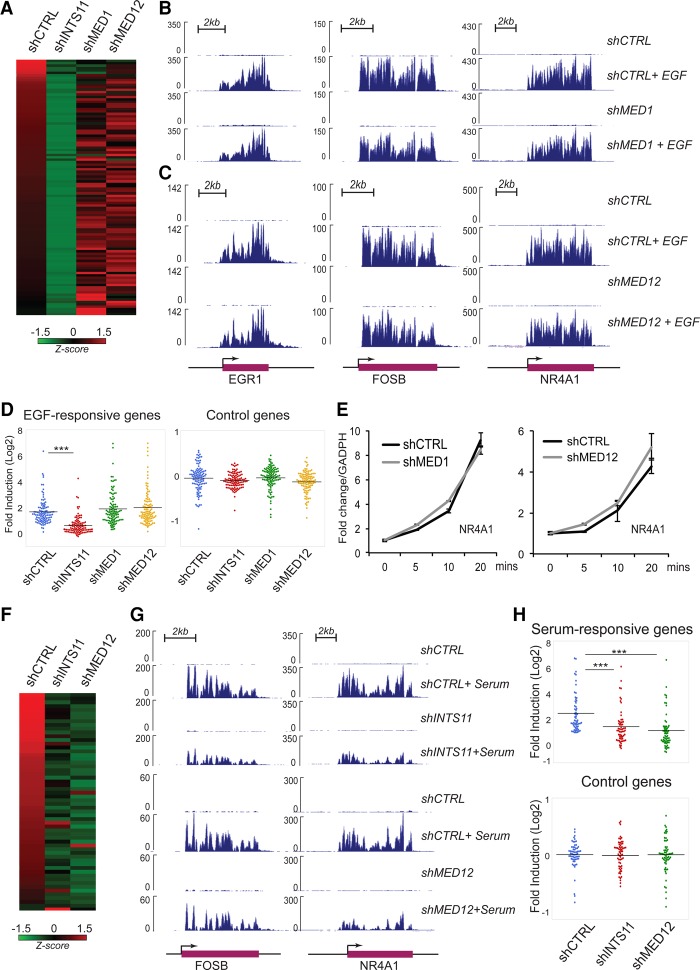
Depletion of Mediator subunits does not significantly affect MAPK responsiveness. (A) Heat map representing the fold induction of 106 EGF-induced genes in HeLa cells following treatment with shCTRL or shRNA against INTS11, MED1, or MED12. All experiments were performed in at least two biological repeats. Each lane represents the fold ratio of gene expression changes before and after 20 min of EGF stimulation. The heat map is ranked from the highest to the lowest fold induction of EGF-responsive genes. (B,C) EGF-induced gene expression at EGR1, FOSB, and NR4A1 loci did not change by the presence of shRNA control or shRNA against MED1 (B) or MED12 (C), as revealed by ChromRNA-seq. (D) Dot plots represent significant impairments of EGF-induced activation by INTS11 knockdown but not by knockdown of MED1 or MED12. Average expression levels of 106 EGF-induced genes or control genes were measured by fold induction after EGF treatment. (***) P < 0.001 for all comparisons, t-test. (E) Knockdown of MED1 or MED12 does not affect EGF-induced NR4A1 gene activation. The gene transcription level was measured before and after 5, 10, and 20 min of EGF induction using quantitative RT–PCR (qRT–PCR). Shown in the figure is the average from three independent experiments. Error bars represent SEM. (F) Heat map representing the fold induction of 60 serum-induced genes after treatment with shCTRL or shRNA against INTS11 or MED12. Each lane represents the fold ratio of gene expression changes before and after 20 min of serum stimulation. All genes were induced by at least twofold. FPKM > 1; q-value < 0.05. The heat map is ranked from the highest to the lowest fold induction of serum-responsive genes. (G) Serum-induced gene expression at FOSB and NR4A1 loci was reduced by the presence of shRNA against INTS11 or MED12. (H, top) Dot plots showing that loss of INTS11 or MED12 abrogates the serum-induced transcriptional activation on serum-responsive genes. (Bottom) There is no significant change in control genes. The serum-responsive genes are listed in Supplemental Table S5. (***) P < 0.001, t-test.

