
Figure 5.
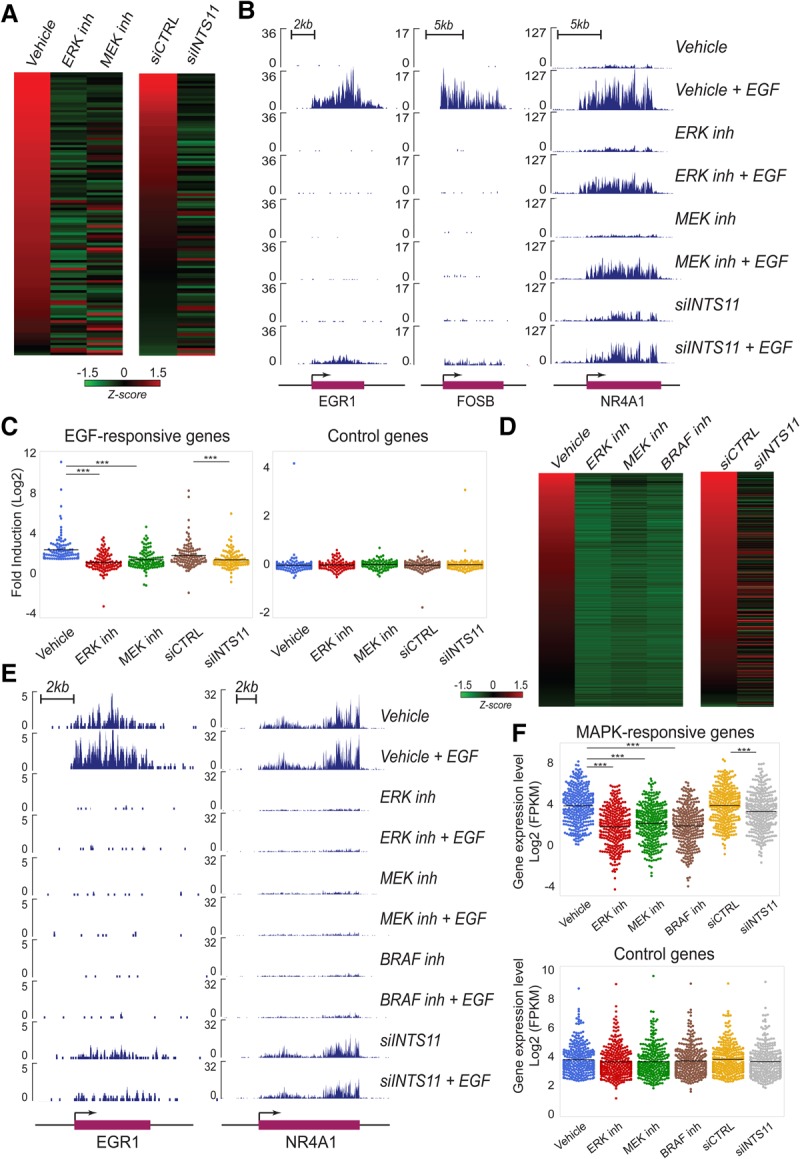
Integrator directs MAPK transcriptional responsiveness in cancers with MAPK-activating mutations. All experiments were performed in at least two biological repeats. (A–C) Lung adenocarcinoma cells (A549) with KRAS-activating mutation. (D–F) Melanoma cells with the V600E BRAF mutation (A375). Heat maps representing the activation of EGF-responsive genes in A549 cells (A) or genes responsive to MAPK inhibitors in A375 cells (D) treated with DMSO, ERK inhibitor (SCH772984), MEK inhibitor (PD0325901), BRAF inhibitor (vemurafenib; only in D), nontargeting siRNA, or siRNA against INTS11. Heat maps are ranked from the highest to the lowest fold induction of EGF-responsive genes (A) or highest FPKM (D). The EGF-responsive genes in A549 cells are listed in Supplemental Table S6, and the genes responsive to MAPK inhibitors in A375 cells are listed in Supplemental Table S7. (B,E) ChromRNA-seq analysis of EGF-induced gene expression at EGR1, FOSB, and NR4A1 loci restrained by ERK1/2 inhibition, MEK inhibition, BRAF inhibition (only in E), or siRNA against INTS11. (C,F) Dot plots represent the fold induction of EGF-responsive genes (C) and gene expression level of MAPK-responsive genes (F) after treatment with inhibitors or siRNAs. (***) P < 0.001 for corresponding comparisons, t-test. All EGF genes were induced by at least twofold (FPKM > 1; q-value < 0.05), and the genes responsive to MAPK inhibitors were reduced by at least twofold (FPKM > 1; q-value < 0.05) in the three treatments (MEK, ERK, and BRAF inhibitors).