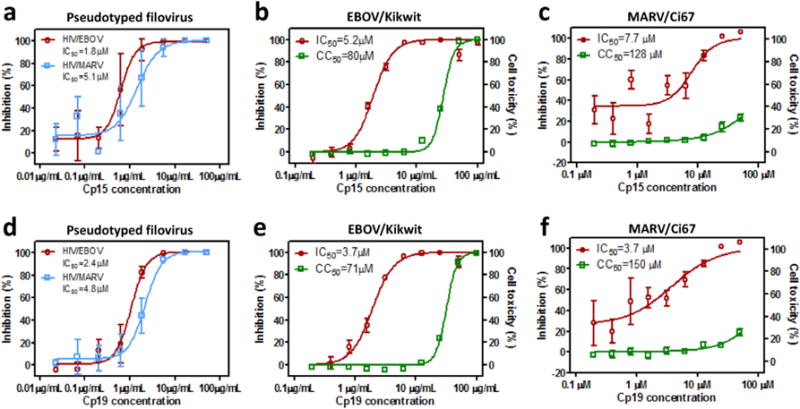
Fig. 2. Anti-filovirus activities of cp15 and cp19.

The in vitro dose-response curves of cp15 is shown in (a) against HIV/EBOV (red) and HIV/MARV (blue) pseudovirion infections in A549 cells, (b) against infectious EBOV/Kikwit infection (red) in A549 cells or in cell toxicity assay (green), and (c) against infectious MARV/Ci67 infection (red) in Hela cells or in cell toxicity assay (green). The in vitro dose-response curves of cp19 is shown in (d) against EBOV (red) and MARV (blue) pseudovirion infections in A549 cells, (e) against infectious EBOV/Kikwit infection (red) in A549 cells or in cell toxicity assay (green), and (f) against infectious MARV/Ci67 infection (red) in Hela cells or in cell toxicity assay (green). The data are mean ± SD for pseudoviruses from two independent experiments (n = 6); the data mean ± SD for infectious filovirus from two independent experiments (n = 4). (For interpretation of the references to colour in this figure legend, the reader is referred to the web version of this article.)
