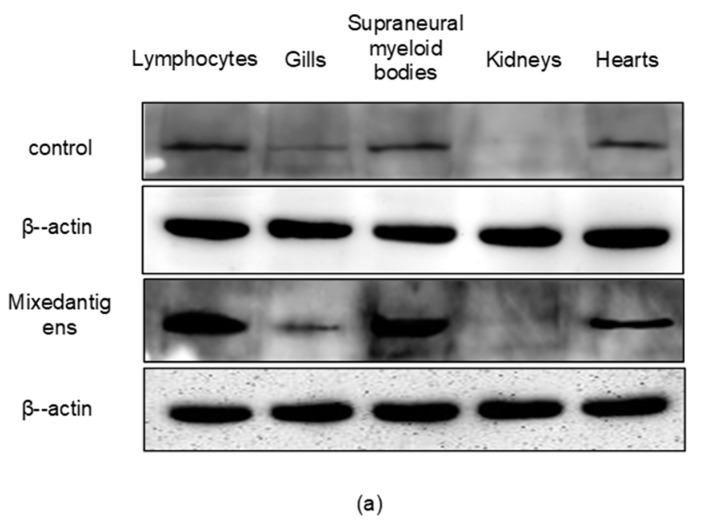
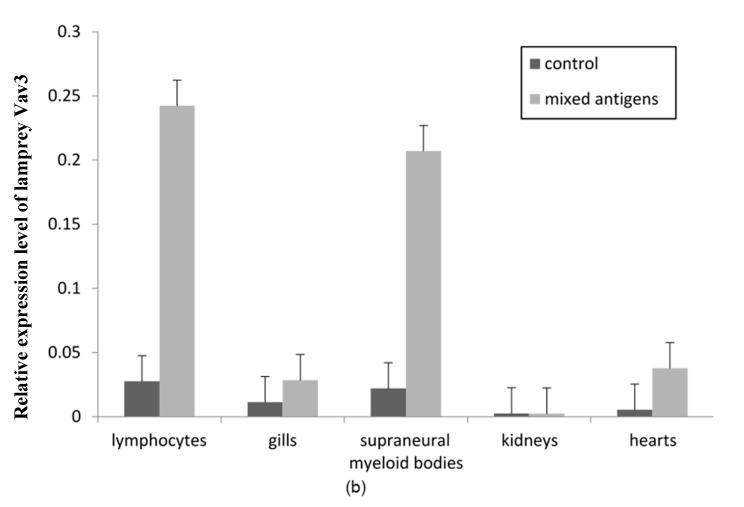
Figure 5.
The relative expression levels of lamprey Vav3 in lamprey immune-related tissues after challenged with mixed-antigens. Total protein samples were isolated from immune-related tissues. (a) Western blotting analysis was performed to detect the expression levels of lamprey Vav3 with β-actin of L. japonica as an internal control; (b) A column chart created using data from three independent Western blotting analysis results. Data are presented as mean ± S.D. The significant difference p < 0.01 is shown with asterisks **.


