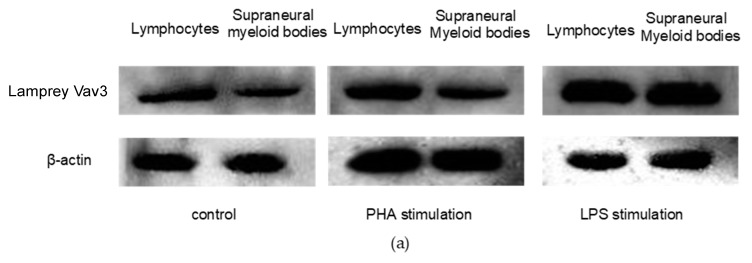
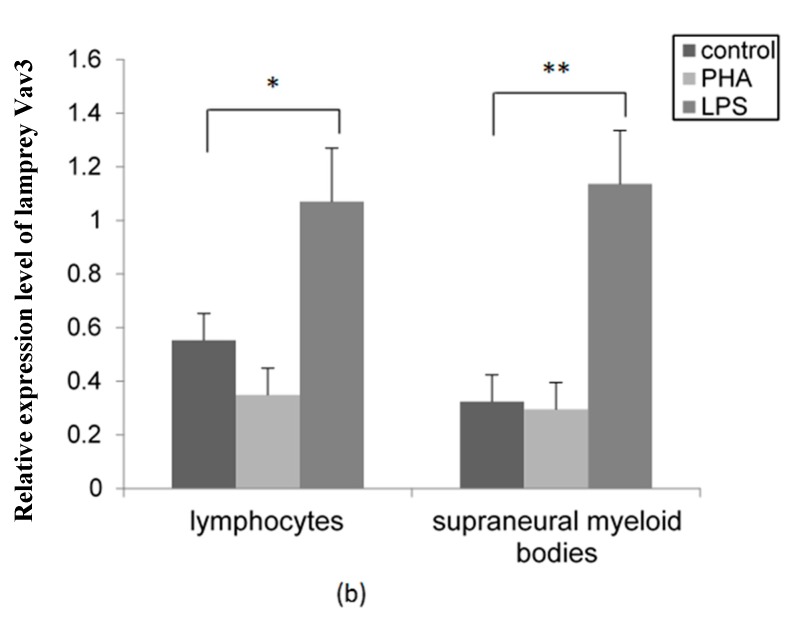
Figure 6.
The expression property of lamprey Vav3 in response to the stimulation of lipopolysaccharide or phytohemagglutinin. Two groups of animals were stimulated with lipopolysaccharide (LPS) or phytohemagglutinin (PHA). Lymphocytes and supraneural myeloid bodies were isolated from the animals stimulated with LPS, PHA or not for extracting total protein samples. (a) Western blotting analysis was used to detect the expression levels of lamprey Vav3 as described in Materials and Methods Section; (b) A column chart created using data from three independent Western blotting analysis results. Data are presented as mean ± S.D. The significant differences p < 0.05 or p < 0.01 are shown with asterisks * or **, respectively.


