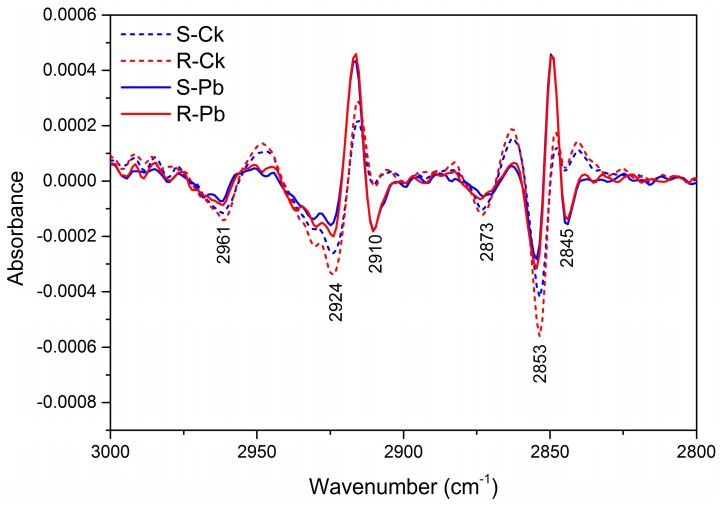
Figure 2.
Absorbance of second derivatives in the lipid region (3000–2800 cm−1) for non-inoculated (Ck) and inoculated (Pb) samples of susceptible (S) and resistant (R) plants. Data were averaged over 20 pellets (10 per replicate) for each treatment. For secondary derivatives, dips represent the increase in chemistry; it goes in the opposite direction of spectral intensity.

