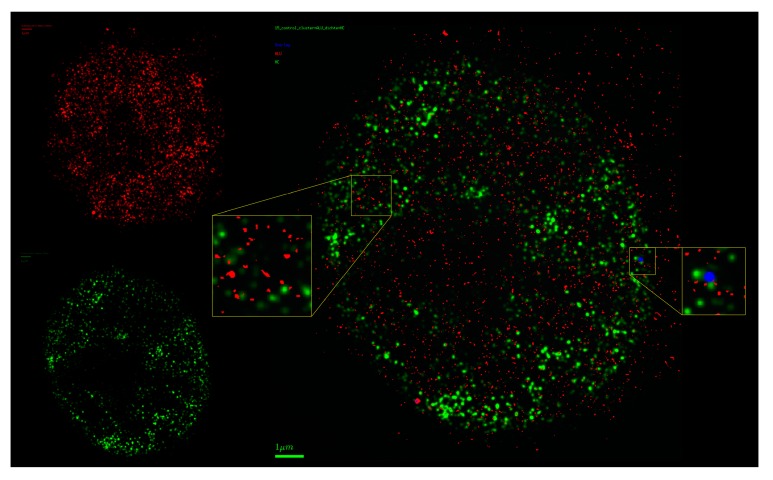
Figure 8.
Visualization of the point matrix after two-color localization microscopy data acquisition. ALU COMBO-FISH oligonucleotides are labeled in red; heterochromatin methylation sites simultaneously labeled by antibodies (H3K9me3) are shown in green. The right image shows the merged visualization. The enlarged inserts demonstrate the exclusive arrangement of ALU sequences and heterochromatin target sites. In the whole image, only one (blue point) locus suggests a co-localization, which may be due to optical overlap (scale bar 1 µm for the merged image).

