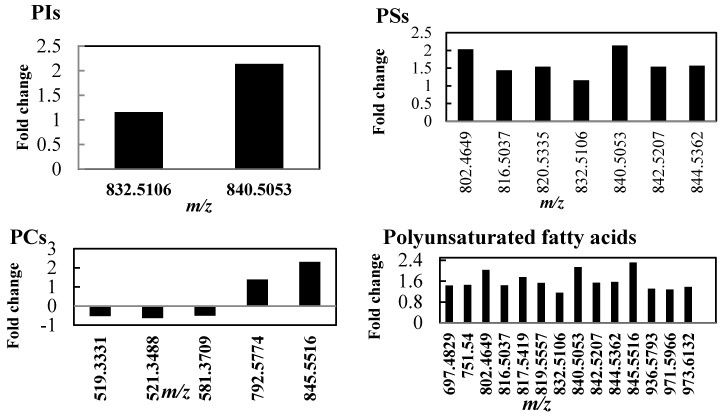
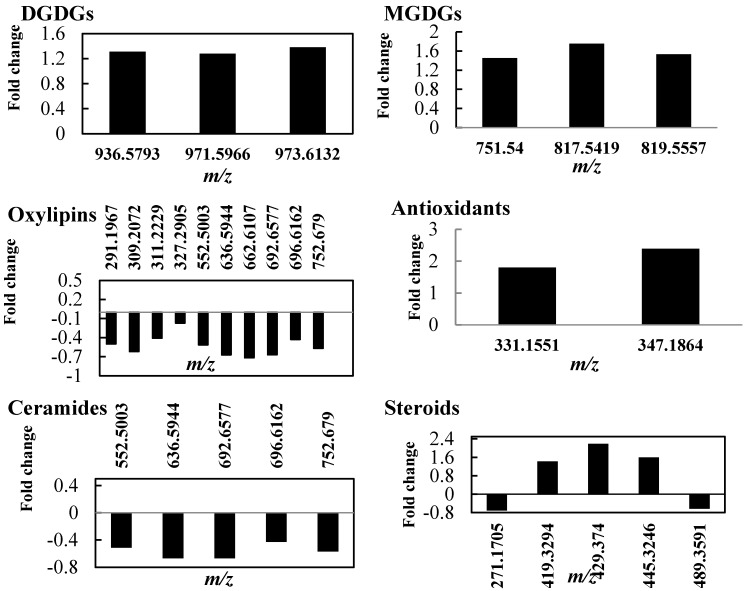
Figure 3.
Lipid composition changes in tolerant thyme plants under drought conditions. After withholding water, thyme leaves were harvested and non-polar extracts were analyzed by DI FT-ICR mass spectrometry. The vertical axis represents the fold change between the control and stressed plants. The mass-to-charge (m/z) values are reported next to each bar (abbreviations: PI, phosphatidylinositol; PS, phosphatidylserine; PC, phosphatidylcholin; DGDGs, digalactosyldiacylglycerols; MGDGs, monogalactosyldiacylglycerols).


