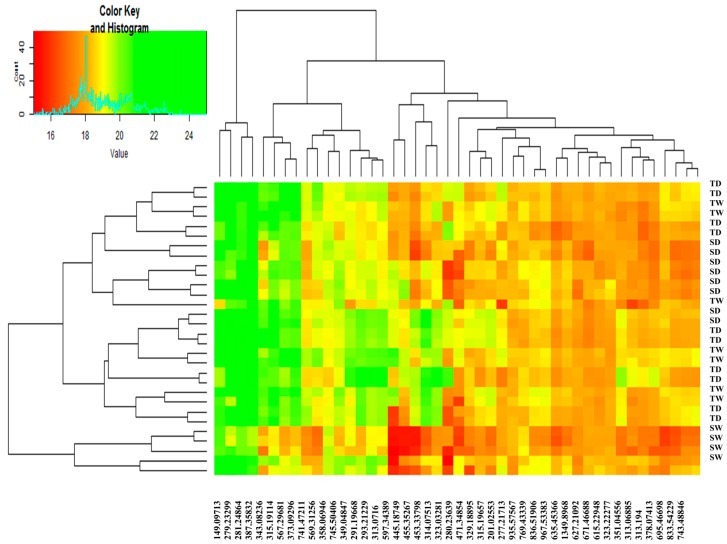
Figure 6.
Hierarchically clustered heat map of the data. Forty-five peaks were divided into four groups (SD, sensitive drought-stressed; SW, sensitive watered; TD, tolerant drought-stressed; TW: tolerant watered). Different colors indicate the relative abundance of each metabolite in different conditions.

