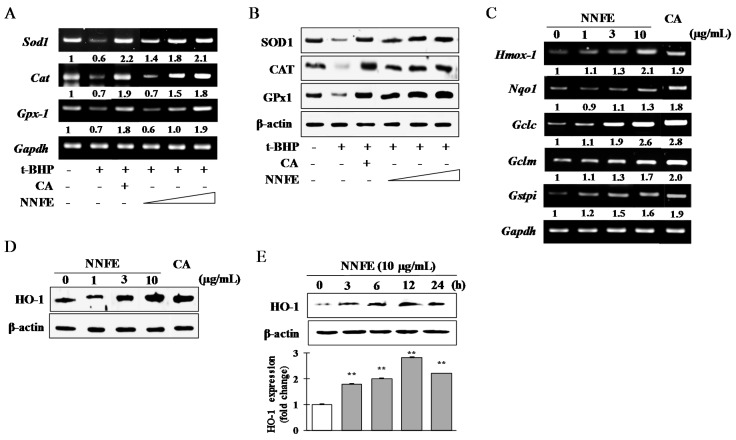
Figure 4.
Analysis of primary and phase II antioxidant and detoxifying enzymes. RAW 264.7 cells were pretreated for 12 h with NNFE followed by 12 h treatment with 100 μM t-BHP. Primary antioxidant enzyme mRNA expression (A) and protein expression (B) were analyzed by reverse transcription-polymerase chain reaction (RT-PCR) and western blot, respectively. NNFE (1, 3, and 10 μg/mL) was applied from left to right. RAW 264.7 cells were pretreated for 24 h with NNFE. The mRNA of phase II antioxidant and detoxifying enzymes (C) were measured by RT-PCR. The effect on heme oxygenase 1 (HO-1) protein levels in a concentration-dependent (D) and time-dependent (E) manner was analyzed by western blot. The symbol “**” indicates statistical significance compared to control as determined by one-way ANOVA (** p < 0.01). CA: Caffeic acid 5 μM. SOD1: superoxide dismutase 1; CAT: chloramphenicol acetyl transferase; GPx1: glutathione peroxidase 1. (−): no treatment (+): treatment with t-BHP, white triangle: concentration low to high.

