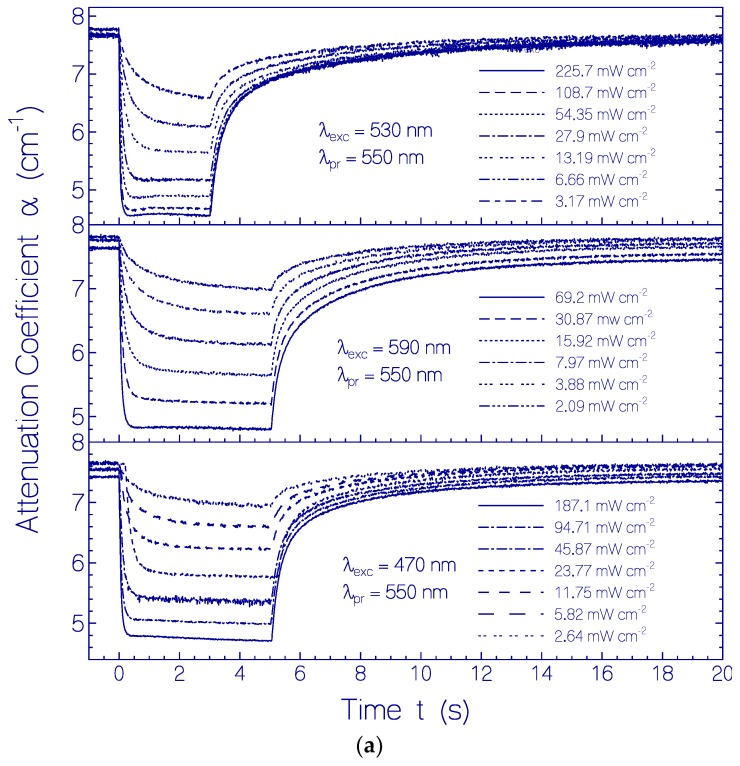
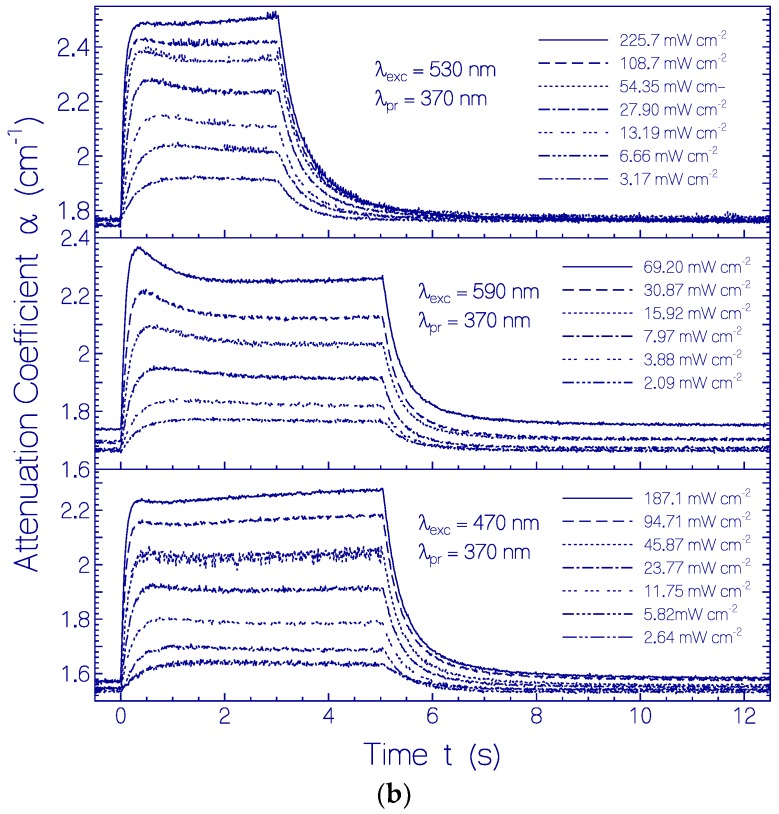
Figure 8.
Temporal attenuation coefficient development of CaRh in pH 7.3 HEPES/MOPS buffer at (a) λpr = 550 nm and (b) λpr = 370 nm before, during, and after photo-excitation with LED 530 nm (top parts), LED 590 nm (middle parts), and LED 470 nm (bottom parts). The applied input excitation intensities Iexc are listed in the sub-figures.


