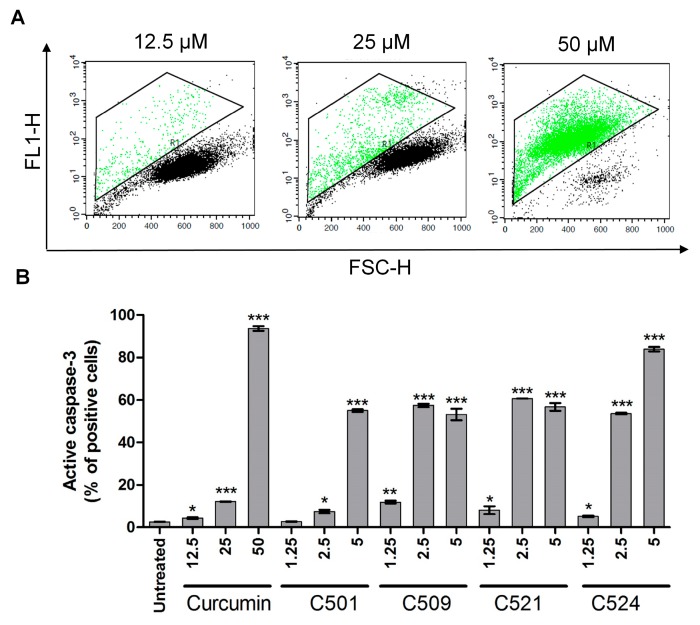
Figure 7.
Curcumin and analogs activated caspase-3 in PANC-1 cells. (A) Representative FL1-FSC dot plots and (B) arithmetic means of percentages ±SD of cells with active caspase-3 show data of cells treated with curcumin and curcumin analogs with the indicated concentrations (µM) on the graph for 72 h. Active caspase-3 was analyzed by flow cytometry as described in Section 3.3.3. Materials and Methods, * p < 0.05, ** p < 0.01, *** p < 0.001.

