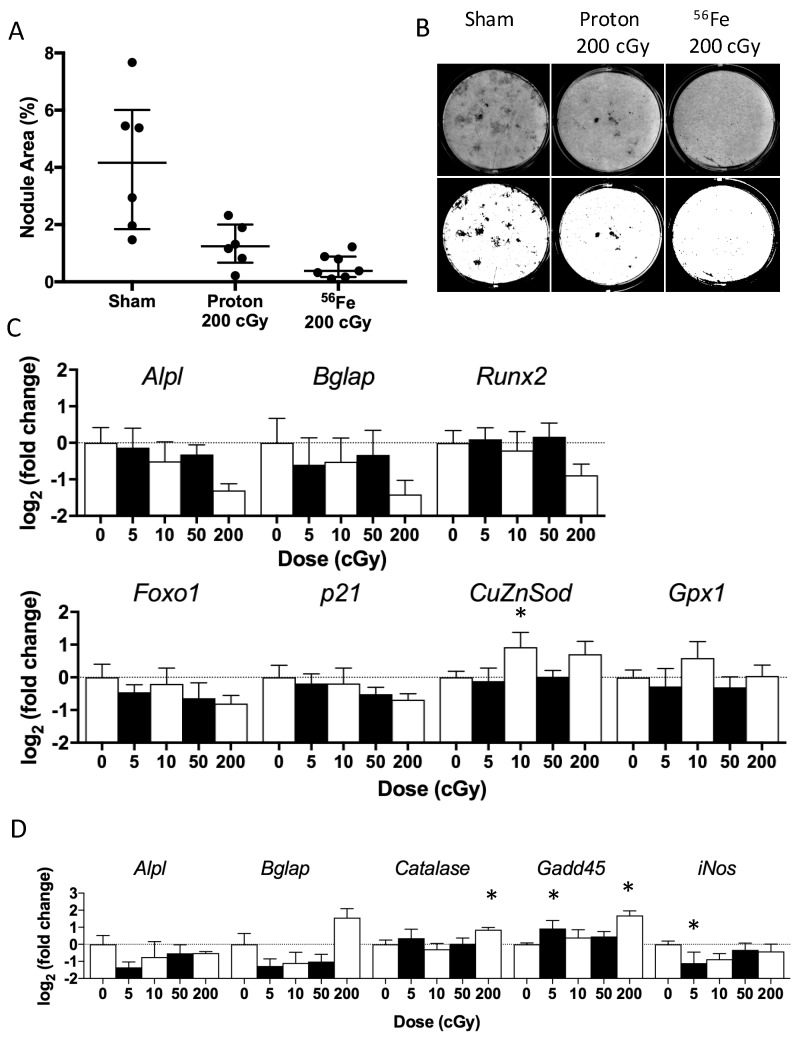
Figure 4.
Differentiation and proliferation responses of osteoprogenitors cultured from bone marrow of mice that received proton or 56Fe irradiation (5 weeks post-irradiation from mice in Figure 1A). (A) Nodule area of cultures from animals irradiated with 200 cGy proton or 56Fe compared to sham control. Data are summarized by median and interquartile range with n = 6–7/group. Each dot represents an individual mouse. (B) Grayscale (top row) and binarized (bottom row) images of representative wells (i.e., near the group median), showing nodules during the mineralization phase for 200 cGy proton or iron or sham. Gene expression assessed during (C) terminal differentiation or (D) proliferation for markers of differentiation, damage response, cell cycle, and redox response in cells cultured from the marrow of previously irradiated mice. Data are mean ± standard deviation of Log2 (Fold Change) transformed values relative to the endogenous gene HPRT and normalized to the sham control (i.e., ΔΔCt). The dashed line at 1.0 indicates the sham control level. n = 4/group, * denotes p ≤ 0.05 vs. sham-control.

