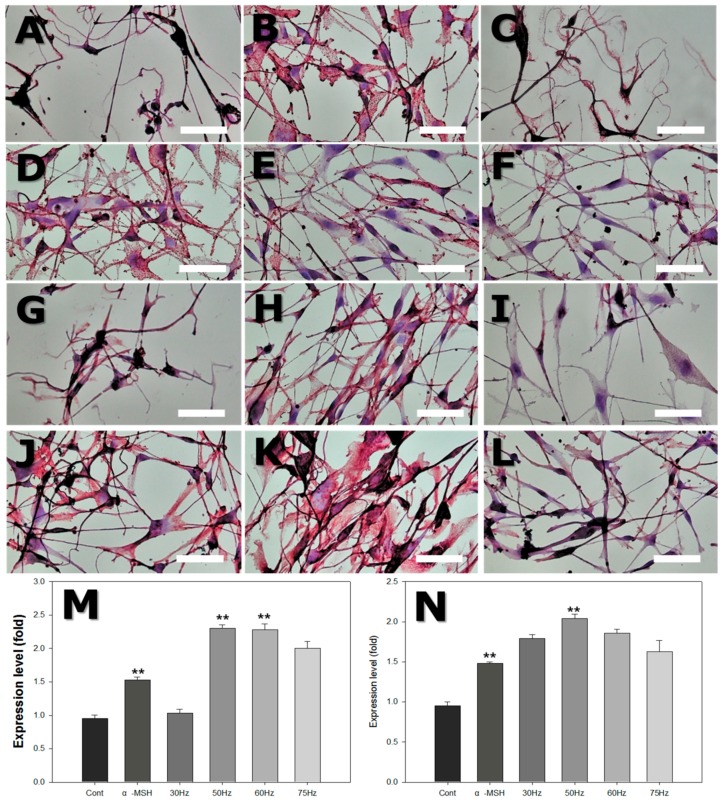
Figure 9.
Light microscope photograph of human skin melanocytes attached to dish surface, stained with HMB45 and Melan-A after exposure to extremely low frequency electromagnetic field (ELF-EMF) for 72 h. (A–F) with HMB45 staining: (A) Control (Cont); (B) alpha-melanocyte-stimulating hormone (α-MSH); (C) 30 Hz; (D) 50 Hz; (E) 60 Hz; and (F) 75 Hz. (G–L) with Melan-A staining: (G) Control; (H) α-MSH; (I) 30 Hz; (J) 50 Hz; (K) 60 Hz; and (L) 75 Hz. Original magnification was ×400; bar = 50 μm. Quantitative analysis of expression levels of HMB45 (M) and Melan-A (N) after ELF-EMFs exposure. Each bar represents the mean ± standard error of independent experiments performed in triplicate (n = 4). ** p < 0.01, compared to the control.

