Figure 5.
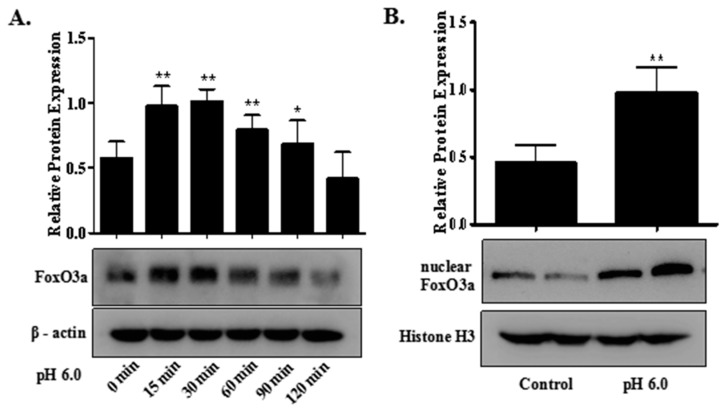
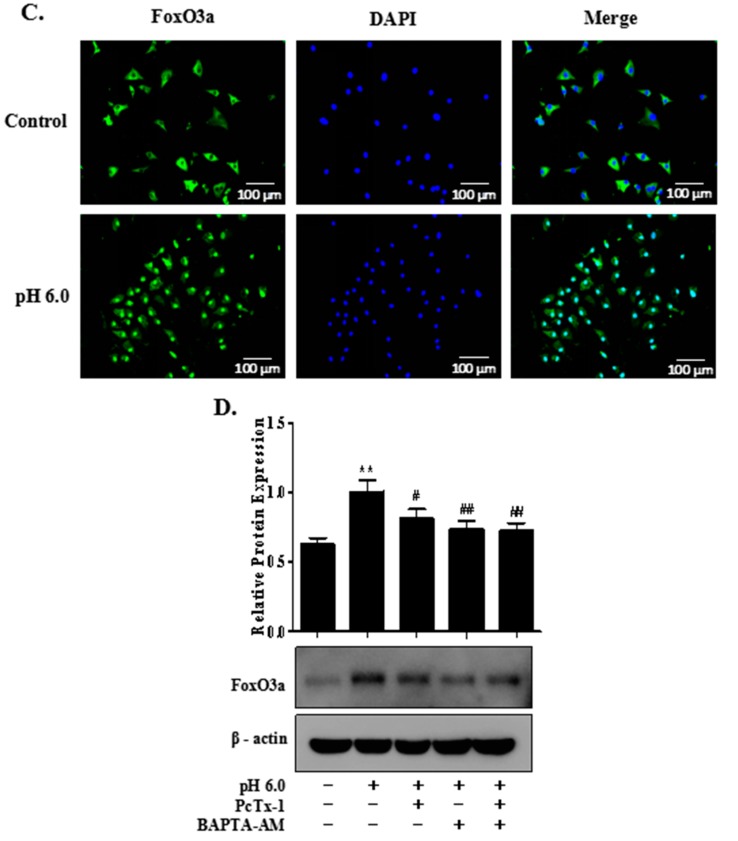
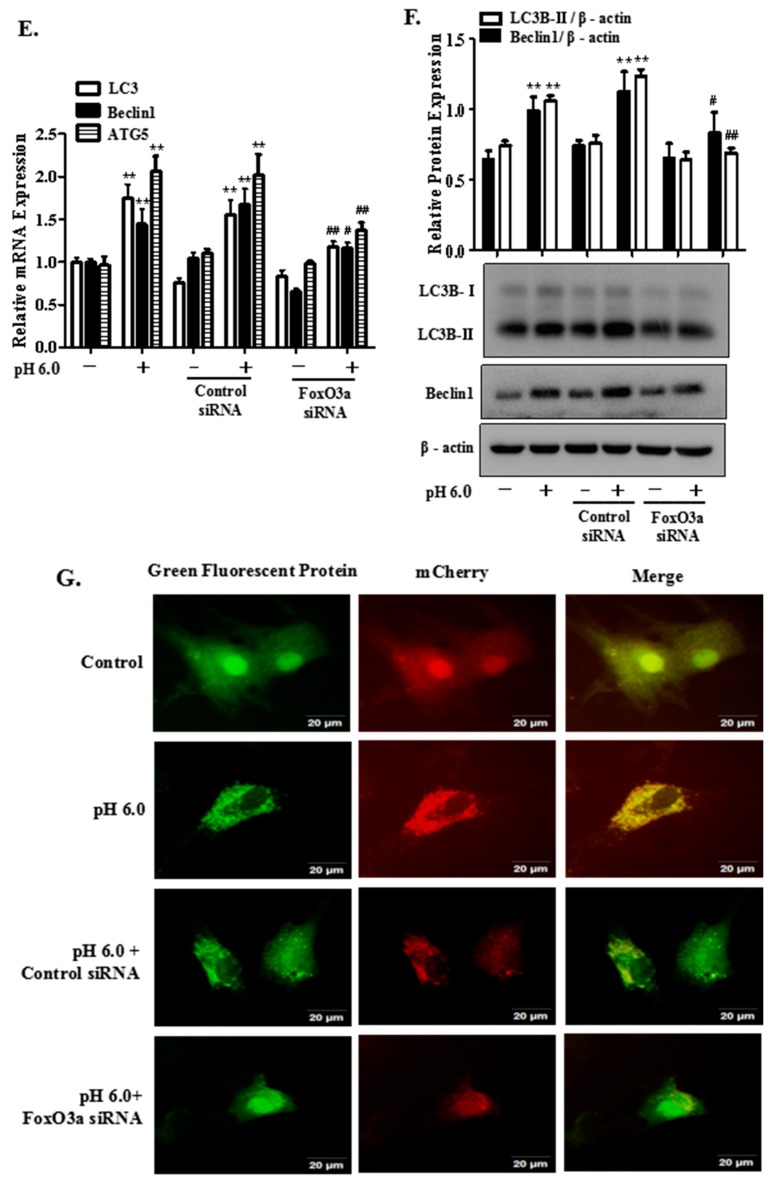
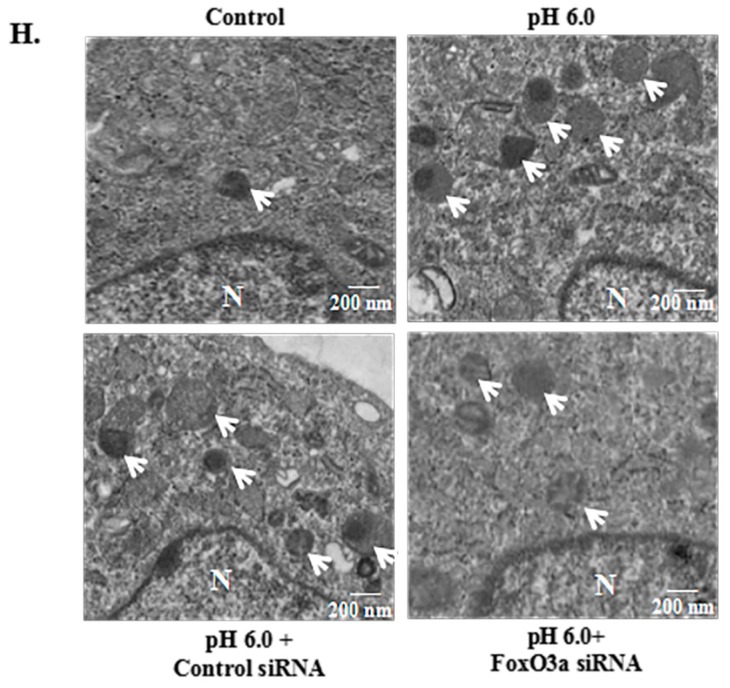
FoxO3a signaling is involved in ASIC1a-mediated articular chondrocytes autophagy. (A) rat articular chondrocytes were incubated with extracellular acid (pH 6.0) for the indicated time periods. The protein expression of FoxO3a was assessed by Western blot; (B) nuclear and cytoplasmic FoxO3a proteins were isolated as described in materials and methods and expression level of FoxO3a in nuclear fraction was determined by Western blot analysis; histone H3 was used as normalized control in nuclear protein; (C) representative immunofluorescence analysis was performed on articular chondrocytes using anti-FoxO3a (green) antibody after acid treatment for 30 min. Nuclei were counterstained with DAPI (blue). Merge contains the combined image of FoxO3a immunostaining and DAPI staining. Scale bar = 100 μm. DAPI: 4′,6-diamidino-2-phenylindole, a fluorescent stain that binds strongly to A-T rich regions in DNA. (D) pretreatment with ASIC1a-specific blocker, PcTx1 and calcium chelating agent, BAPTA-AM for 1 h, articular chondrocytes were stimulated with extracellular acid (pH 6.0) for 30 min. The FoxO3a protein expression was determined by Western blotting; (E,F) rat articular chondrocytes were transfected with siRNA targeting FoxO3a or scrambled control siRNA. After transfection, articular chondrocytes were treated with extracellular acid; (E) mRNAs were isolated from articular chondrocytes and qRT-PCR was performed; (F) the protein expression of Beclin1, LC3B-II were determined by Western blot analysis; (G) rat articular chondrocytes were transfected with a mCherry-EGFP-LC3B plasmid and FoxO3a-siRNA or control-siRNA and then treated with extracellular acid, the GFP-LC3 puncta (green dots) and autophagosomes (yellow dots) and autolysosomes (red dots) were analyzed by fluorescence microscopy. Scale bar = 20 μm; (H) rat articular chondrocytes were transfected with FoxO3a-siRNA or control-siRNA and then treated with extracellular acid. The ultrastructure of the chondrocytes was imaged using transmission electron microscopy. N: nucleus; White arrows: autophagosomes. All images were shown at 20,000× magnification. Data were presented as mean ± SD of three independent experiments. * p < 0.05, ** p < 0.01 versus control group; # p < 0.05, ## p < 0.01 versus pH 6.0 group.


