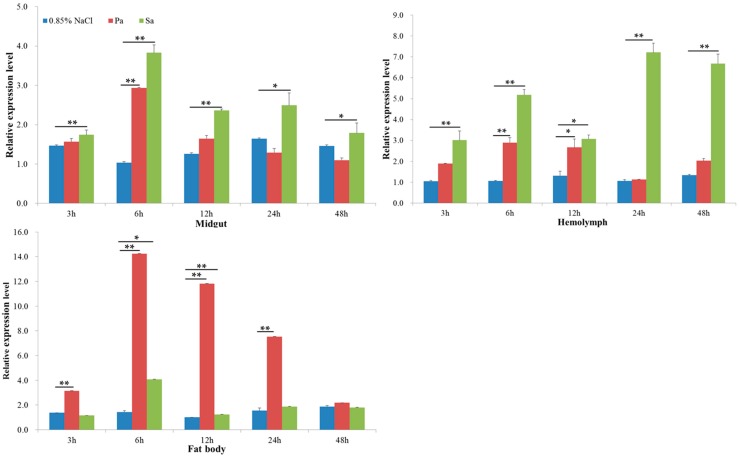
Figure 5.
The expression levels of ScFerHCH in the midgut, fat body and hemolymph after injection with P. aeruginosa (Pa) and S. aureus (Sa) at 3, 6, 12, 24 and 48 h. Sterile 0.85% NaCl was used as a control. Relative expression levels were calculated using the 2−∆∆Ct method. Statistical analysis was performed using the SPSS software. The significant differences are indicated by * (p < 0.05) or ** (p < 0.01).

