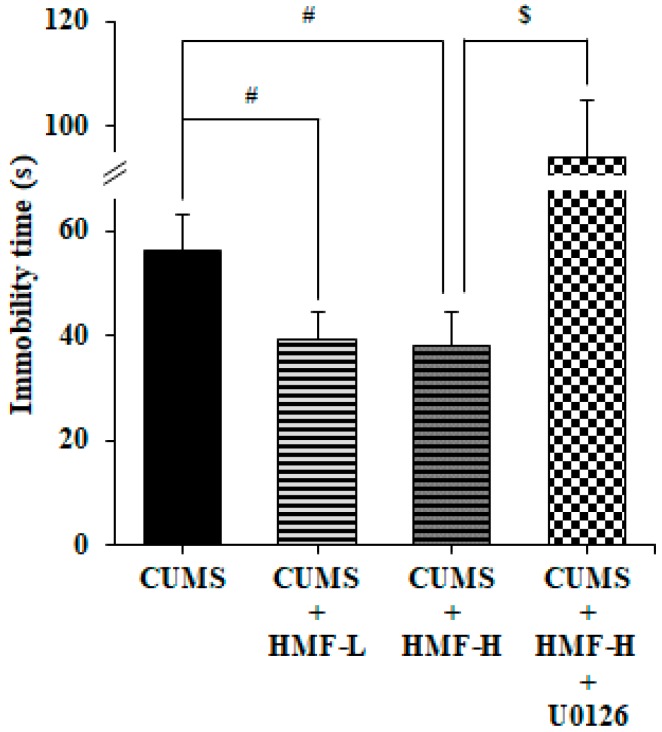
Figure 5.
Effects of HMF on CUMS-induced depression-like behavior in the forced swim test on Day 16. Values are means ± SEM (n = 15–16). Symbols show significant differences between the following groups: CUMS vs. CUMS + HMF-L, CUMS vs. CUMS + HMF-H (# p < 0.05, one-way ANOVA followed by the post-hoc Williams multiple comparison test) and CUMS + HMF-H vs. CUMS + HMF-H + U0126 ($ p < 0.05, the Student’s t-test).

