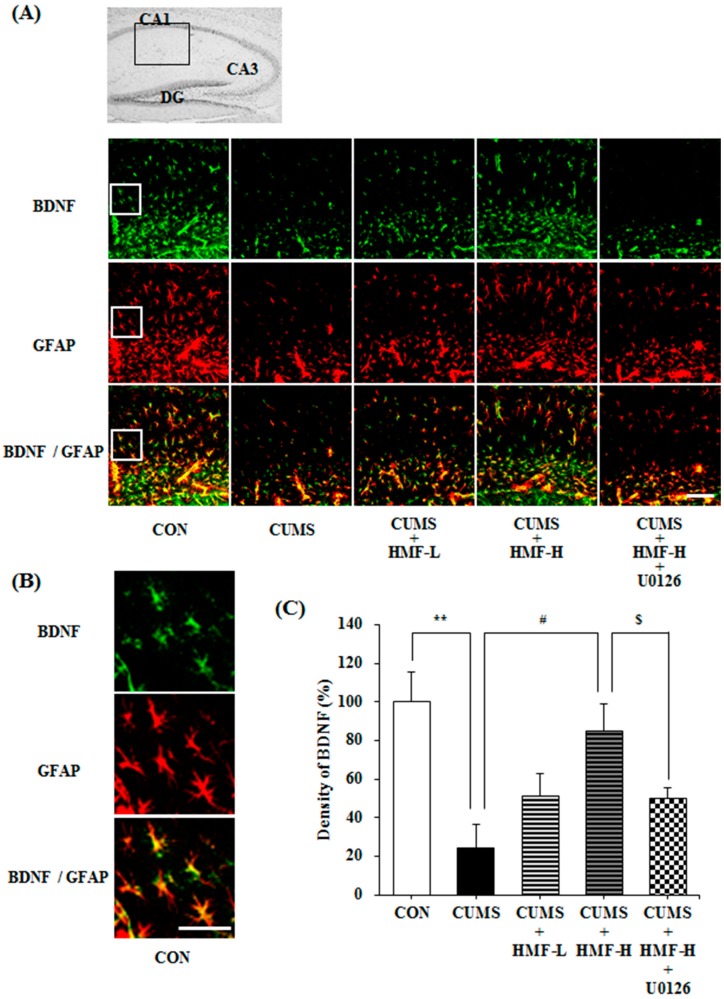
Figure 7.
Effects of HMF on the expression of BDNF and glial fibrillary acidic protein (GFAP) in the CUMS-treated mouse hippocampus on Day 16. (A) Immunoreactivities of BDNF (green) and GFAP (red) with lower magnification. Merged images were shown in yellow. The white scale bar shows 100 μm. The portion for the quantitative analysis was shown with a black square. (B) Immunoreactivities of BDNF (green) and GFAP (red) with higher magnification. Merged images were shown in yellow. The white scale bar shows 100 μm. The portion for the enlargement was shown with a white square in (A). (C) A quantitative analysis of BDNF densities of the total areas of (A). Values are means ± SEM (n = 6–8). Symbols show significant differences between the following groups: CON vs. CUMS (** p < 0.01, the Student’s t-test), CUMS vs. CUMS + HMF-H (# p < 0.05, one-way ANOVA followed by the post-hoc Williams multiple comparison test) and CUMS + HMF-H vs. CUMS + HMF-H + U0126 ($ p < 0.05, the Student’s t-test). CA, cornu ammonis; DG, dentate gyrus.

