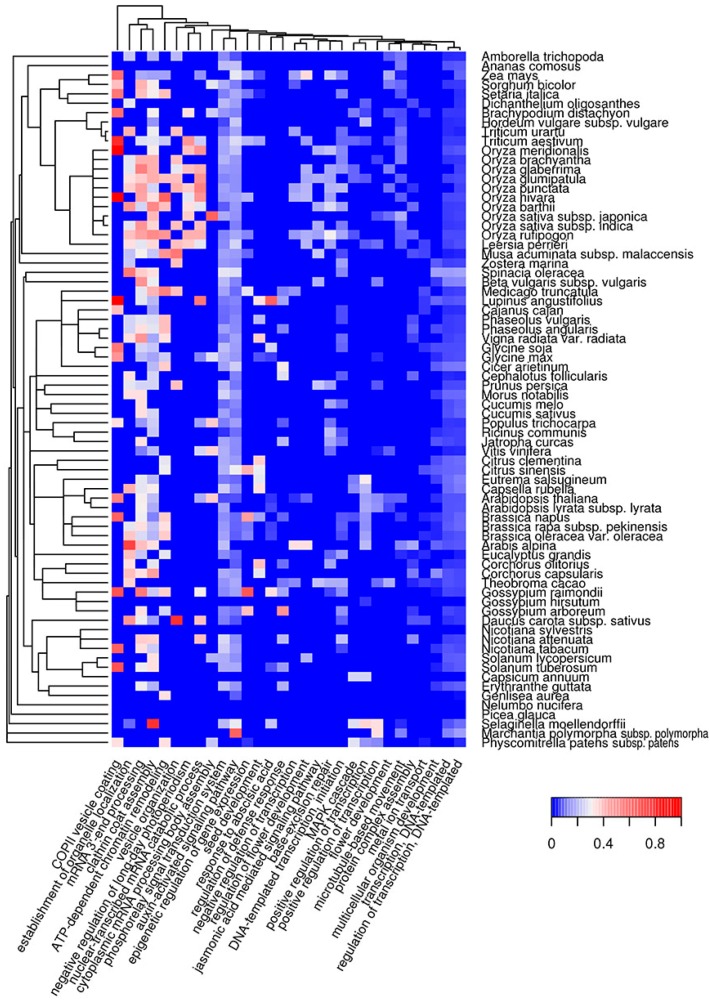
Figure 5.
Heat map of GO biological processes in which QN-rich potentially amyloidogenic proteins predicted by SARP are overrepresented. For such proteins, the top 30 GO terms from the molecular function ontology are shown. The color of the cells denotes the fraction of QN-rich potentially amyloidogenic proteins predicted by SARP among all proteins annotated with this term. All cells with p-values greater than 0.01 have values of 0 (dark blue). The dendrogram of plant species corresponds to their phylogenetic tree.

