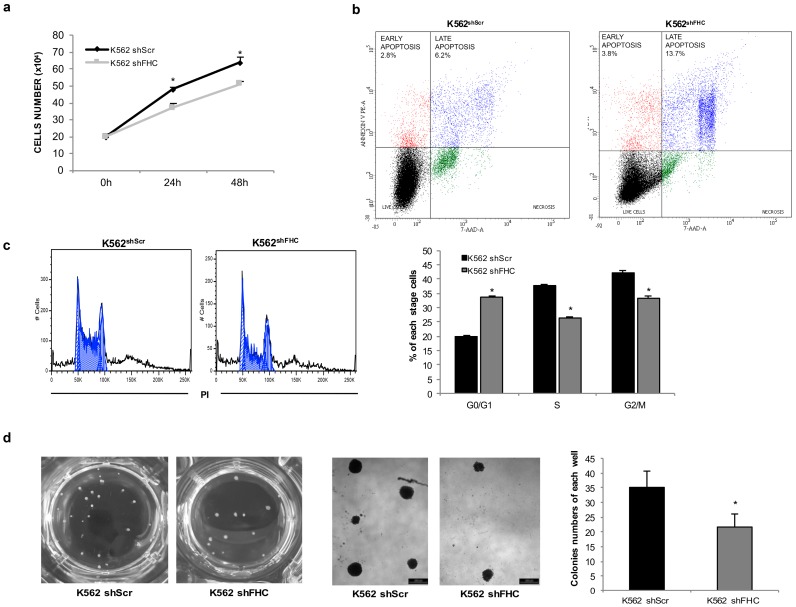
Figure 3.
FHC silencing suppresses the proliferative rate and the clonogenic potential of K562 cells. (a) Direct cell counting of K562shScr and K562shFHC at 0, 24 and 48 h; (b)Apoptosis analysis in K562shScr and K562shFHC using Annexin V/7-AAD double staining. The reported plots are representative of two independent experiments; (c) Representative flow cytometry plots of cell cycle analysis in K562shScr and K562shFHC with statistics on the right side. All data represent mean ± SD (n = 3). * p < 0.05 compared with K562shScr cells; (d) Representative microscopy images and statistics of colony formation assay in K562shScr and K562shFHC; colonies were observed and counted in each well of 12-well plate. Scale bar: 200µm. All data represent mean ± SD (n = 3). * p < 0.05 compared with K562shScr cells.

