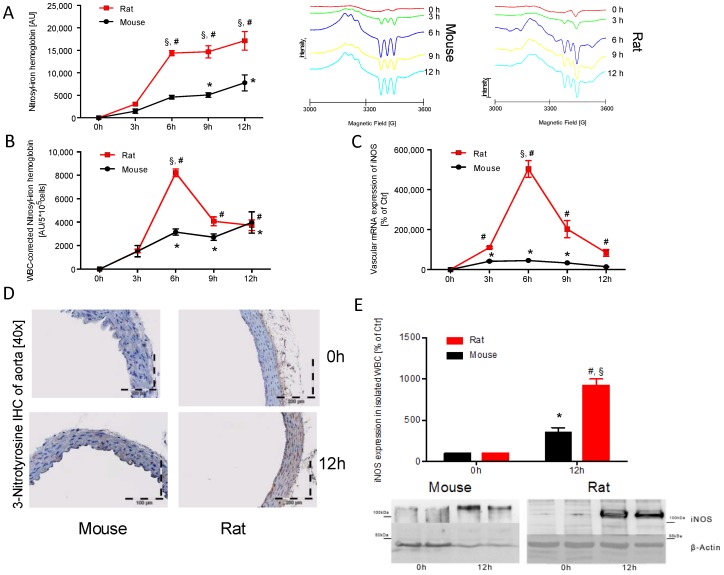
Figure 2.
Time response of nitrosyl-iron hemoglobin and iNOS expression in isolated WBC of mice and rats. Whole blood Hb-NO levels were determined by Electron Paramagnetic Resonance (EPR) spectroscopy as a read-out of iNOS activity (A) and were normalized to the WBC count (B). qRT-PCR was used to determine mRNA expression levels of iNOS in aortic tissue (C). iNOS protein expression was further visualized by immunohistochemistry of paraffin embedded aortic sections after 12 h (D). iNOS protein expression was further investigated in isolated WBC of both species after 12 h using Western-blot technique (E). Each lane in the original blot represents a protein sample from 1–2 animals. The data are mean ± SEM from 6 different animals per group. * p < 0.05 vs. 0 h mouse, # p < 0.05 vs. 0 h rat and § p < 0.05 vs. mouse (same point in time).

