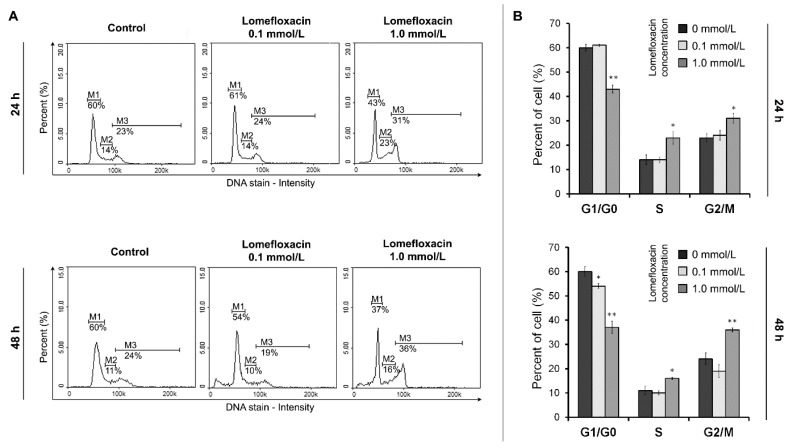
Figure 5.
Cell cycle analysis of COLO829 cells exposed to lomefloxacin. (A) Histograms presenting the cell cycle distribution in cells exposed to lomefloxacin in concentrations of 0.1 and 1.0 mmol/L for 24 and 48 h. The presented histograms are representative of three independent experiments with similar results. The effect of the drug on the cell cycle distribution was investigated by a fluorescence image cytometer after DAPI (4′,6-diamidino-2-phenylindole) staining. M1G1/G0 phase; M2—S-phase; M3—G2/M phase. (B) The effect of lomefloxacin on the cell cycle distribution in COLO829 cells. The cells were treated with lomefloxacin at concentrations of 0.1 and 1.0 mmol/L for 24 and 48 h. Mean values ± SEM from three independent experiments (n = 3) performed in triplicate are presented. * p < 0.05 versus control samples; ** p < 0.005 versus control samples.

