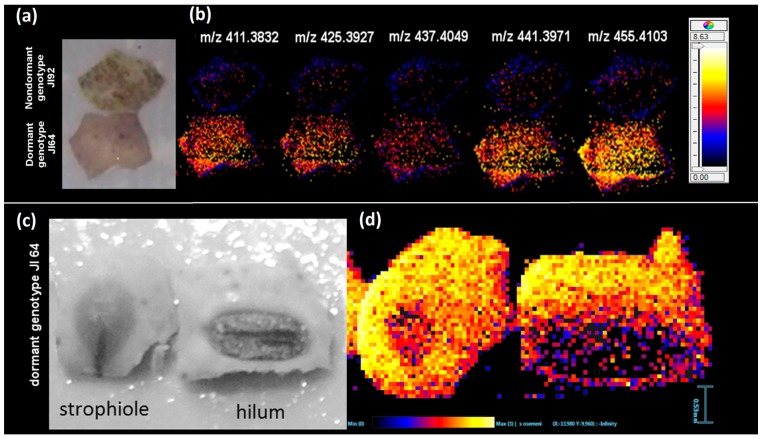
Figure 4.
LDI-MSI analysis of external seed coat surfaces. (a) Optical image of analyzed seed coats used for mass imaging; (b) comparison of distribution of signals (m/z values) of hydroxylated fatty acids on seed coat of dormant JI64 (bottom mass images) and non-dormant JI92 (upper mass images); (c) optical image of parts of JI64 seed coats containing strophiole and hilum used for mass imaging; (d) distribution of dihydroxyoctacosanoate (m/z 455.4103) over the external surface containing strophiola and hilum; matrix free MSI measurement. Colors in the mass images, i.e., (b,d), correspond with intensity of particular HLFA markers (their amounts on seed coat surface) in MS spectra (yellow reflects the highest signal and black the lowest one as displayed by inserted color scales).

