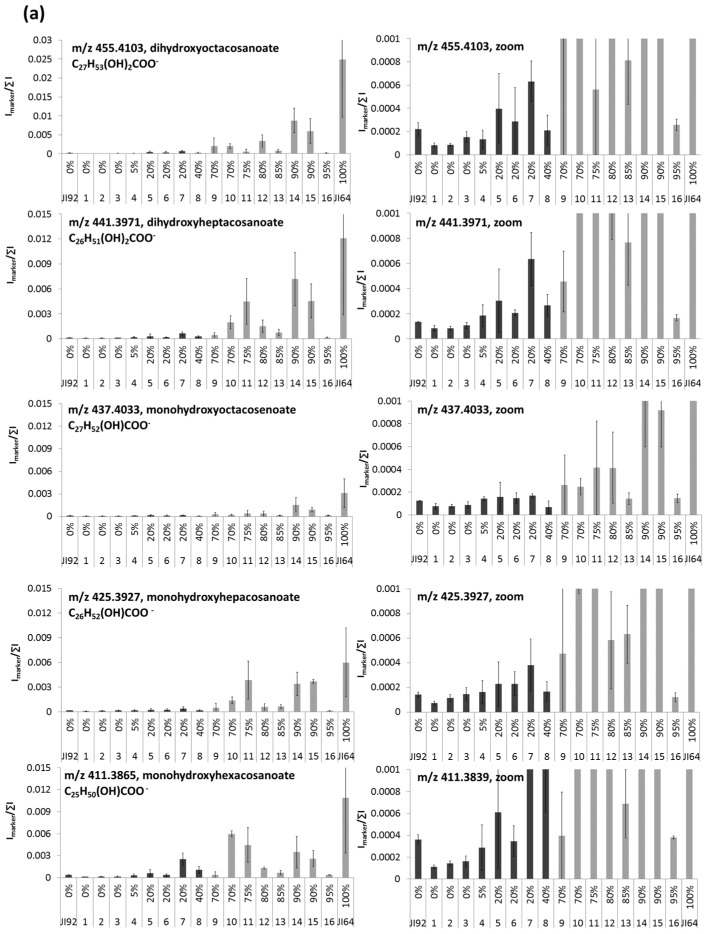
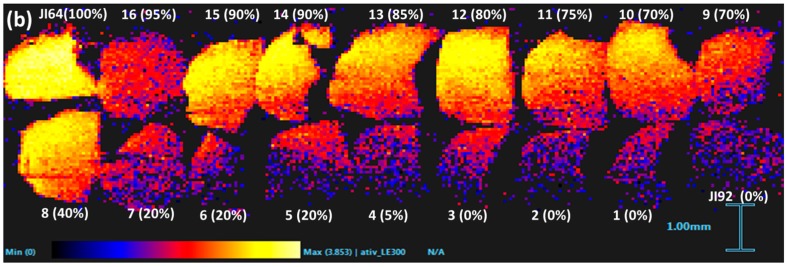
Figure 5.
Relationship of HLFA signals to the dormancy level of JI64, JI92 and respective recombinant inbred lines. (a) signals of individual hydroxylated long chain fatty acids in parent genotypes and RILs obtained by LDI-MS measurement, black bars denote non-dormant and gray ones dormant lines; signal is expressed as an average of normalized intensities of four repeated measurements; (b) distribution of dihydroxyoctacosanoate on the RILs’ surface; numbers at x-axis denote particular RIL lines (1–16), numbers given above the codes of lines in graphs or in parenthesis in mass images, respectively, reflect the dormancy level in percents.


