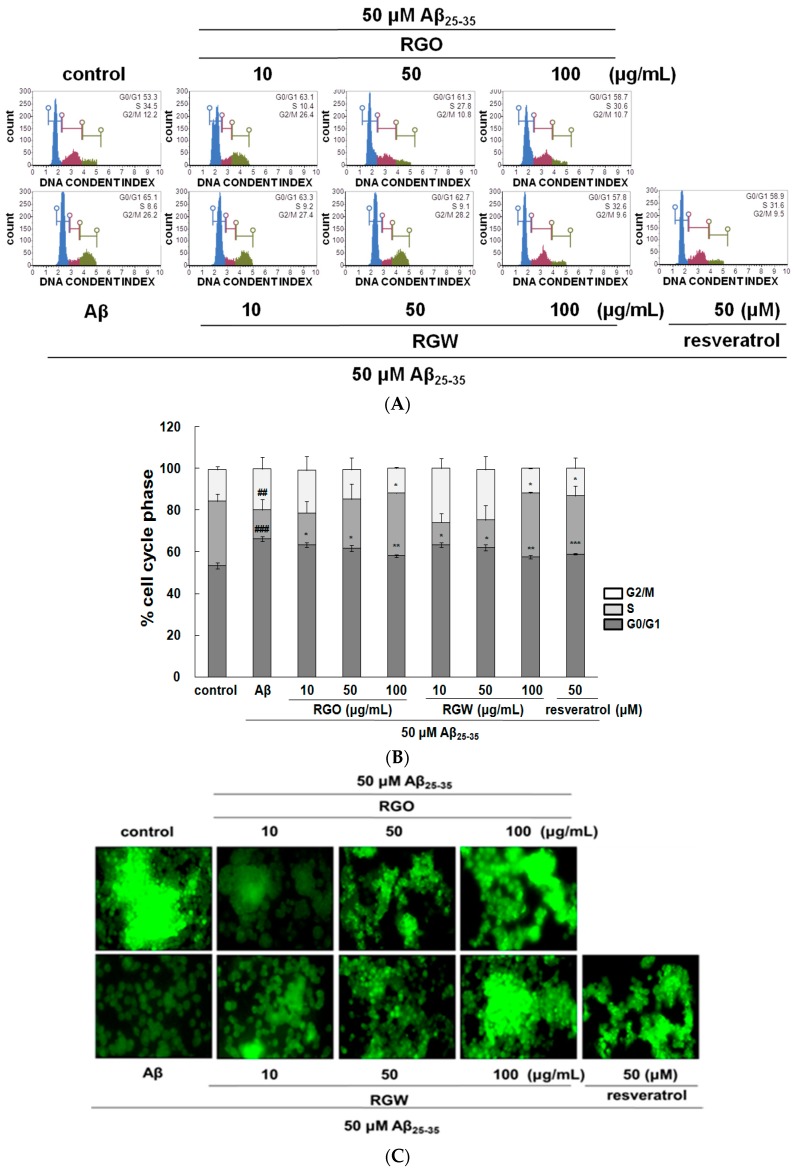
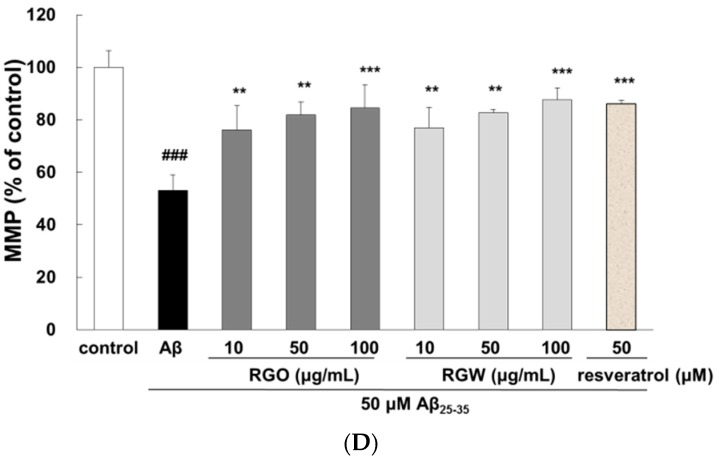
Figure 3.
Effect of RGO and RGW on cell cycle and mitochondrial membrane potential (MMP). Flow cytometry of cell cycle phase (A) and quantification (B). Representative flow cytometry of Rhodamine 123 staining for MMP (×400) (C). Statistical analysis results of the percentage of MMP through Rhodamine 123 intensity (D). The graph shows the cell cycle and MMP as described in Materials and Methods. ### p < 0.001 and ## p < 0.01 compared to control group; *** p < 0.001, ** p < 0.01 and * p < 0.05 compared to Aβ25–35 alone (ANOVA followed by Duncan’s multiple comparison test). Resveratrol was used as a positive control.


