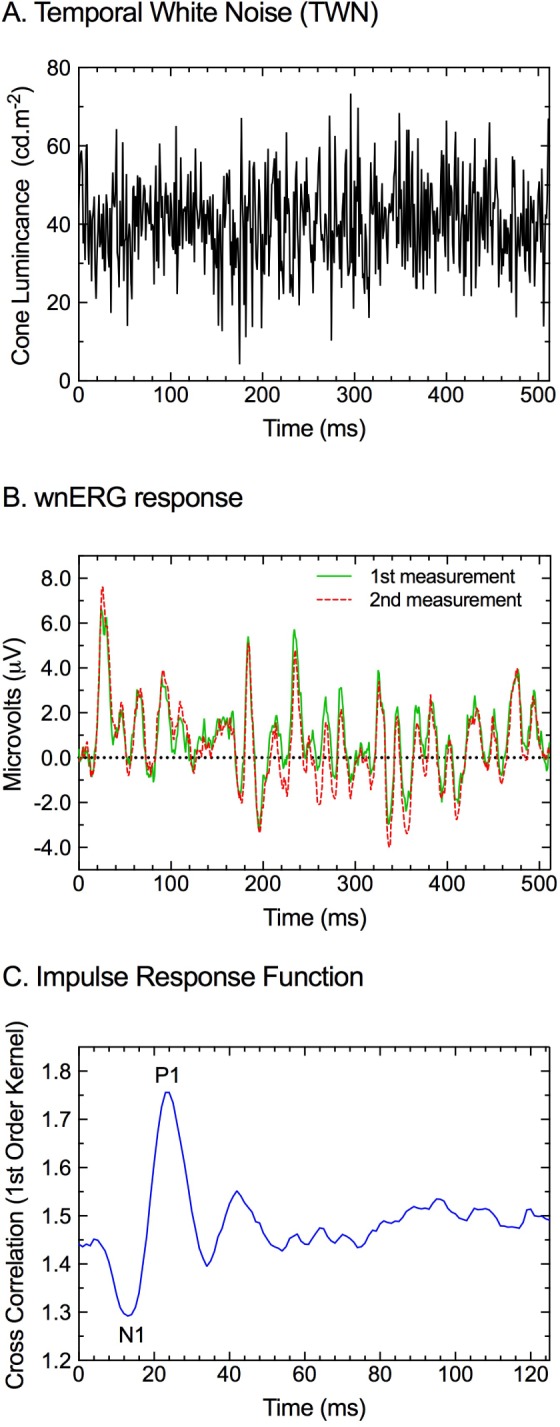
Figure 1.

Calculation of the linear IRF (panel C) through the cross-correlation of the temporal white noise stimulus (panel A) and the measured wnERG (panel B). (A) An exemplar TWN stimulus (0–512 Hz) that modulates above and below a mean adaptation level (40 cd.m−2). (B) The measured full-field (Ganzfeld) wnERG responses (two measurements, green solid and red dashed lines) shown in panel A are the average of 40 sweeps each and are reproducible across repeated measurements. (C) The cross-correlation of the TWN stimulus (panel A) and the resultant wnERG response (panel B) return the linear IRF. Definitions of the N1 and the P1 components are displayed. (Data acquired in the Bradford laboratory).
