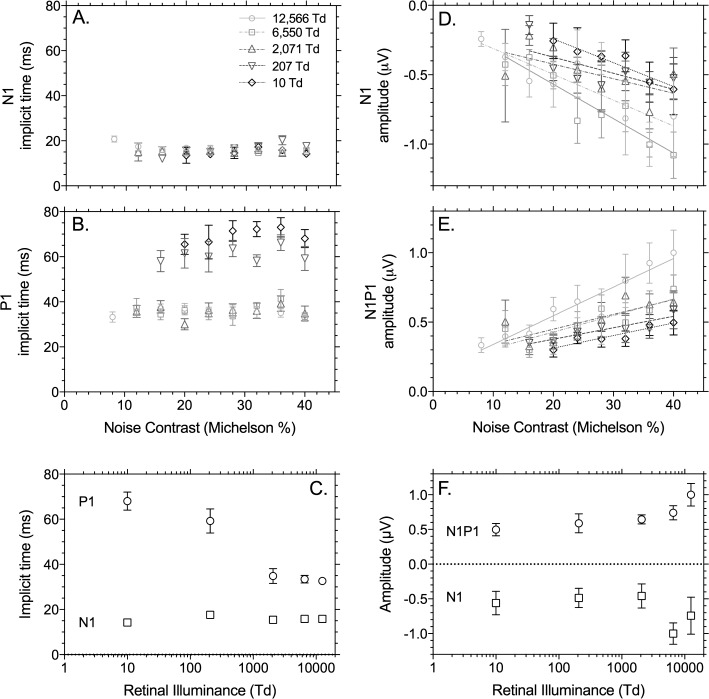
Figure 4.
Summary data of the IRF of the wnERG implicit time and amplitude with focal (39.3° diameter) stimuli measured in Maxwellian view (Brisbane laboratory). Data are from the average of five observers (±SEM). Left columns show implicit time (milliseconds) as a function of noise contrast (Michelson %, panels A and B) and retinal illuminance at 40% Michelson noise contrast (panel C). Right columns show the normalized amplitude as a function of noise contrast (Michelson %, panels D and E) and retinal illuminance at 40% Michelson noise contrast (panel F). The amplitudes are normalized to the N1P1 values obtained at 12,566 td and 40% contrast.

