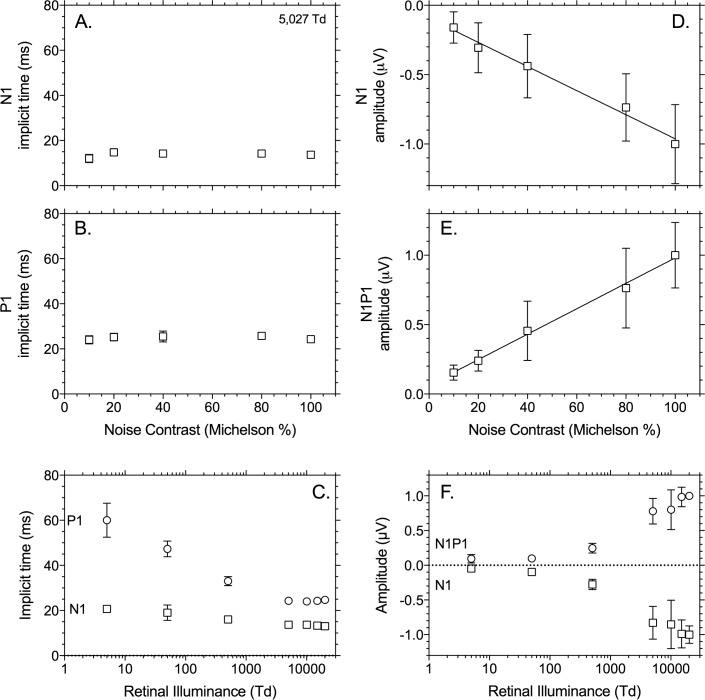
Figure 5.
Summary data of the IRF implicit time and amplitude with full-field (Ganzfeld) stimuli. Data are from the average of three observers (±SEM) (Bradford laboratory). Left panels show the implicit time (milliseconds), and right panels show the amplitude normalized to the N1P1 amplitudes obtained at 100% contrast at 20,000 td. Data are plotted as a function of Michelson noise contrast (%) at a single photopic illumination (5025 td) or as a function of retinal illuminance (td) for the highest measured temporal white noise contrast (100%).

