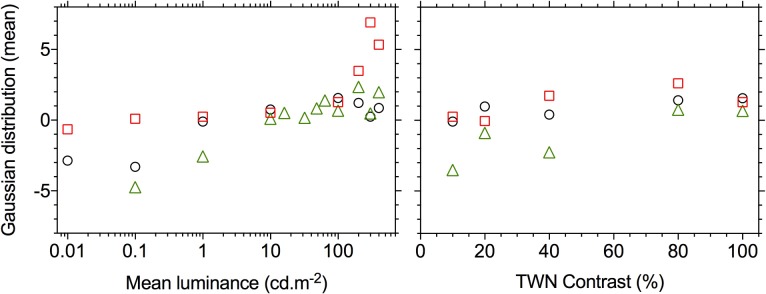
Figure 8.
Means (μ) of fitted Gaussians (from Fig. 7) as a function of mean luminance (left: fixed 100% contrast) and of TWN contrast (right: at a mean luminance of 100 cd.m−2) for three participants (Bradford laboratory). The circles show the data for the representative participant from Figure 7. The 100% contrast measurements were also performed at several luminances between 10 and 100 cd.m−2 for one participant (triangular symbols).

