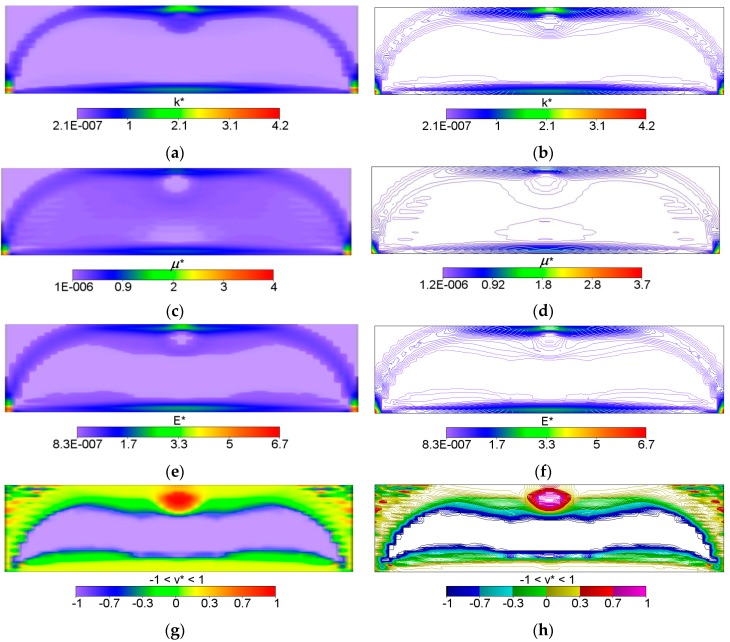
Figure 2.
First six figures: Volume-render (left); and contour (right) views of the optimal and relative (i.e., divided by E0) layouts of (a,b) bulk k*; (c,d) shear μ* and (e,f) Young’s E* moduli, respectively. The last two figures: (g) Volume-render and (h) contours views of optimal distribution of the optimal Poisson’s ratio ν*.

