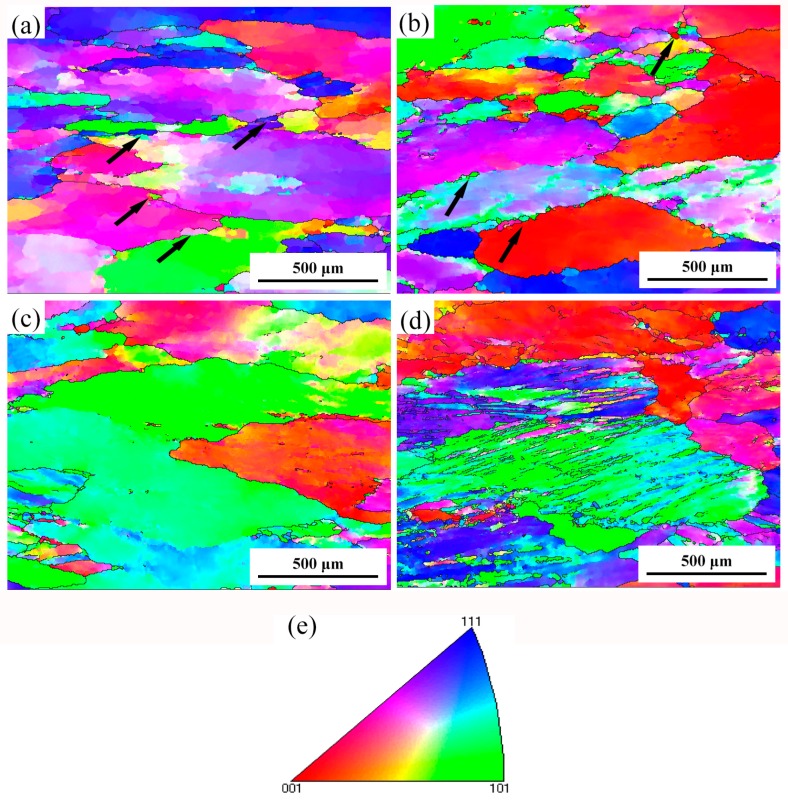
Figure 6.
Microstructures of the specimens deformed under different parameters. (a) 500 °C/0.01 s−1; (b) 450 °C/0.1 s−1; (c) 450 °C/1 s−1; (d) 450 °C/10 s−1, and (e) representation of the color code used to identify the crystallographic orientations on standard stereographic projection (red: [0 0 1]; blue: [1 1 1]; green: [1 0 1]).

