
Fig. 2.
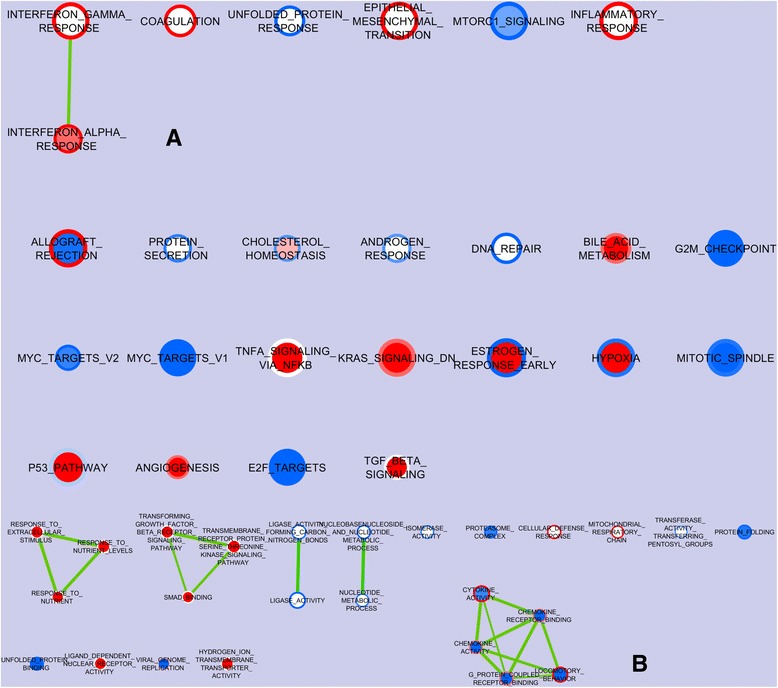
The nodes of the gene sets enriched in the oxyntic mucosa of piglets early associated with CA as compared to the SA piglets and sampled at two or three weeks of age. a The entire picture regarding the Hallmark gene set, summarizing the main biological states or processes; b Picture of nodes obtained with the more detailed gene ontology (GO) gene set after the removal of those related to cell mitosis; the nodes represent gene sets. The color on the center of the node represents the results of the trial ending at 2 wk; the color on the ring visualizes the trial ending at 3 wk. The edges represent the link of two or more gene sets sharing the same core group of genes explaining the enrichment of each of the gene sets. Enrichment significance (P-value) is conveyed as node color intensity where red stands for upregulation at 2 or 3 wk in the CA piglets, and blue stands for downregulation as compared with the SA piglets. The node size represents the number of genes in the gene set