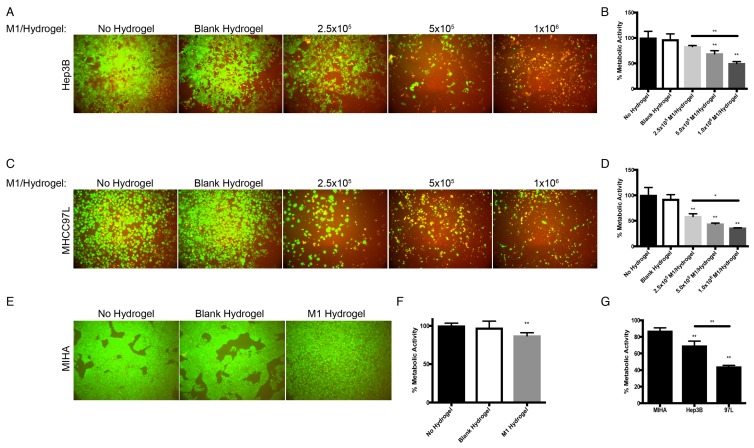
Figure 3.
Dose dependent effects of M1 macrophage-loaded hydrogels on HCC and MIHA cells after 4 days of co-culture. (A) Live/dead images of Hep3B cells after the treatment with M1 hydrogels. (B) Corresponding normalized metabolic activity. (C) Live/dead images of MHCC97L cells after the treatment with M1 hydrogels. (D) Corresponding normalized metabolic activity. (E) Live/dead images of MIHA cells after the treatment with M1 hydrogels. (F) Corresponding normalized metabolic activity. (G) Comparison of normalized metabolic activity between MIHA, Hep3B, and MHCC97L cells after the treatments with M1 hydrogels. The error bar represented as SD. **P<0.01.

