Figure 4.
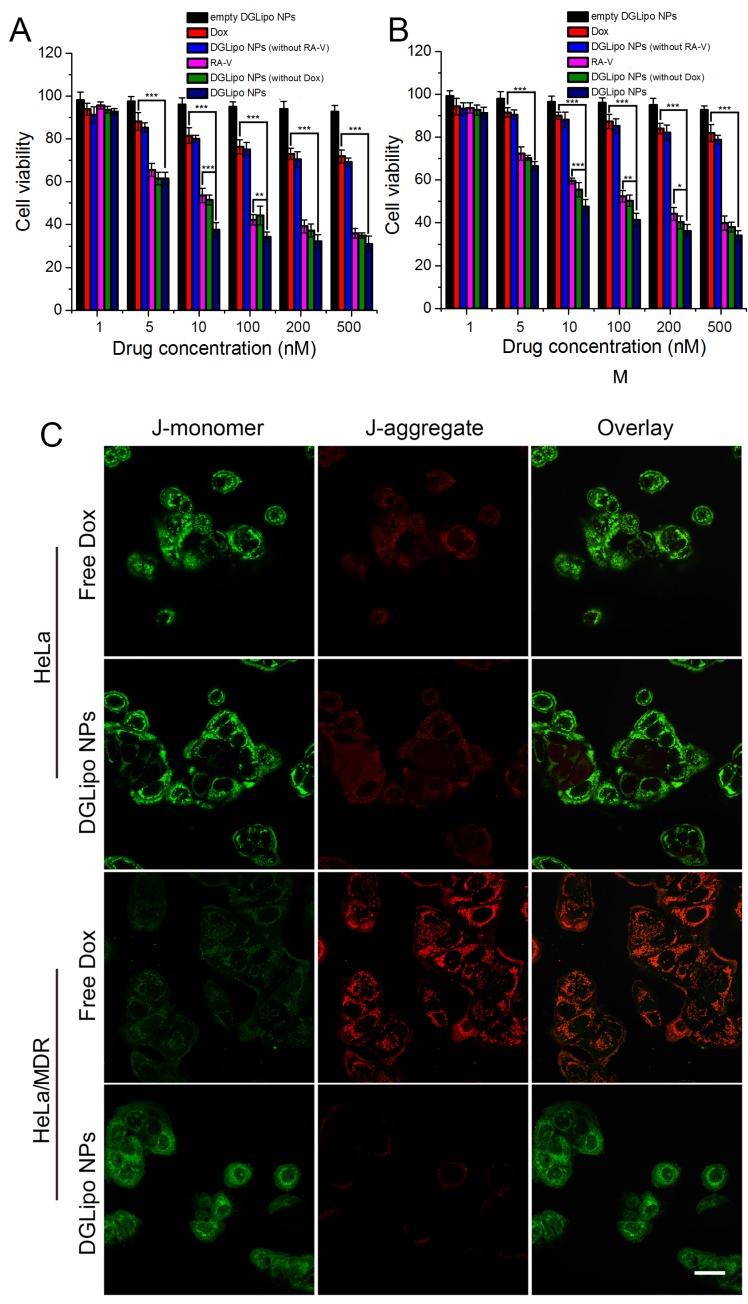
MTT assay of (A) HeLa cells in the presence of different concentrations of empty DGLipo NPs (IC50>500 nM), free RA-V (IC50=37 nM), DGLipo NPs (without Dox) (IC50=30 nM), free Dox (IC50=1800 nM), DGLipo NPs (without RA-V) (IC50>500 nM) and DGLipo NPs (IC50=8 nM). (B) HeLa/MDR cells in the presence of different concentrations of empty DGLipo NPs (IC50>500 nM), free RA-V (IC50=130 nM), DGLipo NPs (without Dox) (IC50=87 nM), free Dox (IC50=10000 nM), DGLipo NPs (without RA-V) (IC50>500 nM) and DGLipo NPs (IC50=10 nM). Data are means ± SD (n = 3), *P < 0.05, **P < 0.01, ***P < 0.001. (C) Confocal fluorescence images of apoptosis by the JC-1 assay in drug-sensitive HeLa and drug resistance HeLa/MDR cells treated with free Dox or DGLipo NPs for 24 h. Scale bars: 40 μm.

